This is so counterintuitive! Generally, how are these types of plots generated? Are they numerically/analytically/empirically determined?
curiousdragon
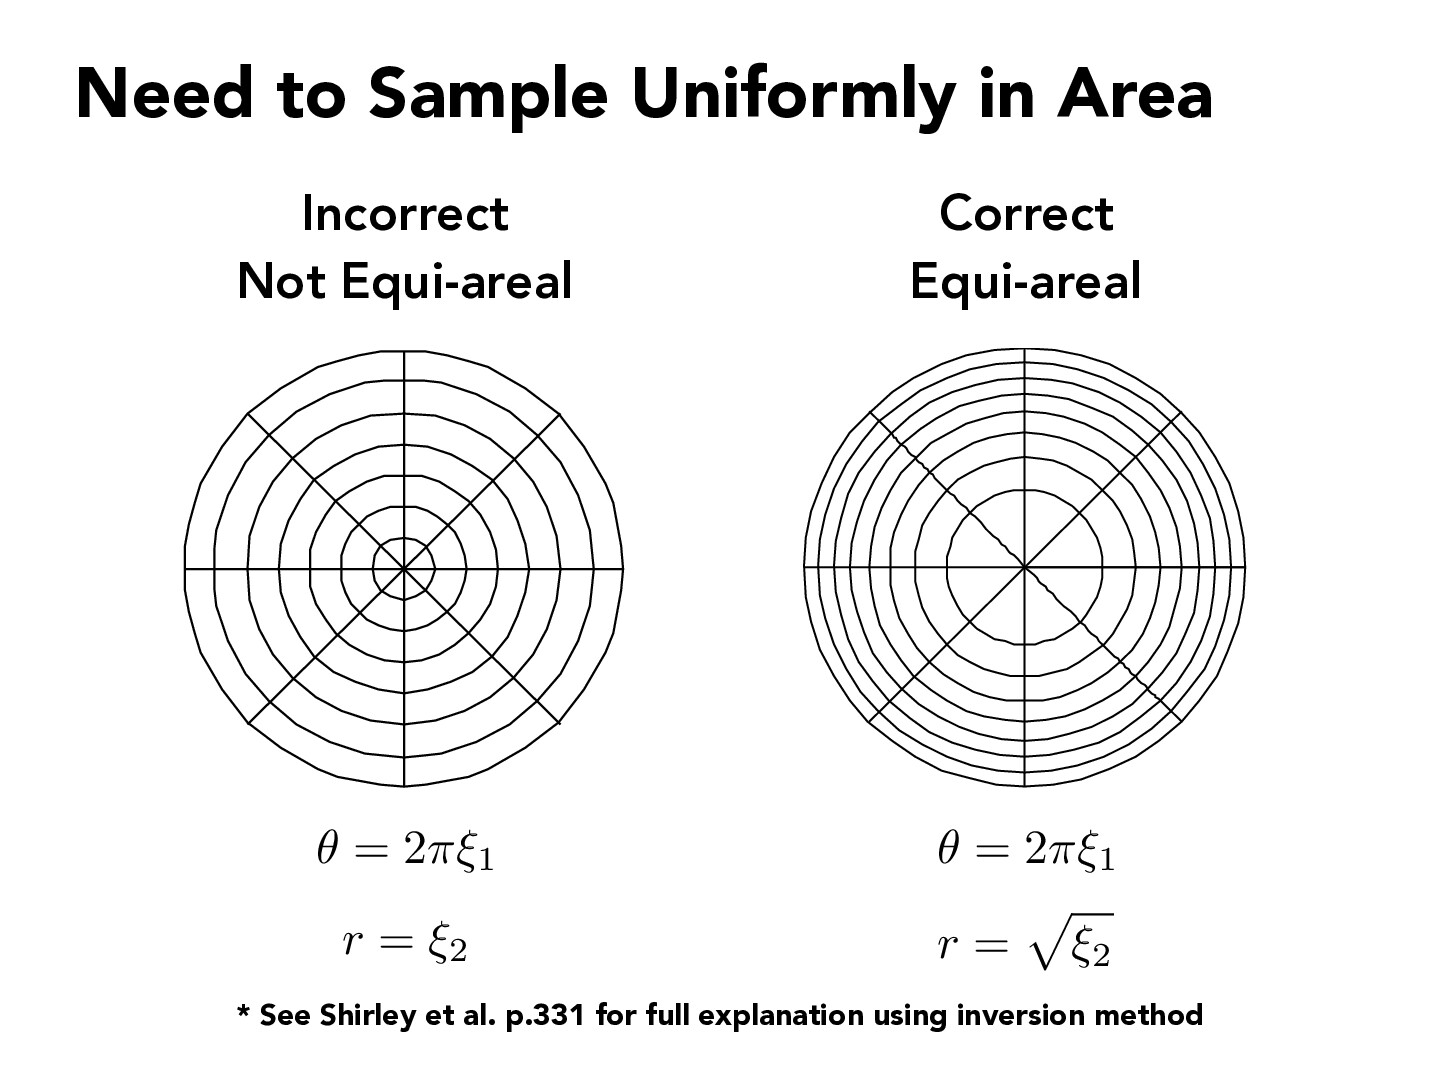
Agreed that this seems counterintuitive initially. I was wondering, would it be possible to have some weighting scheme to allow for the sampling scheme on the left to be equivalent / similar to the sampling scheme on the right?
For example, if we say that the inner most parts of the inner circle on the left should only be sampled at some rate x, but the next larger concentric circle should be sampled at some rate y (y > x)? Since then it feels like we might be able to split up the overall area into more intuitive sections, but still be able to sample "uniformly" under this weighting scheme.
This is so counterintuitive! Generally, how are these types of plots generated? Are they numerically/analytically/empirically determined?
Agreed that this seems counterintuitive initially. I was wondering, would it be possible to have some weighting scheme to allow for the sampling scheme on the left to be equivalent / similar to the sampling scheme on the right?
For example, if we say that the inner most parts of the inner circle on the left should only be sampled at some rate x, but the next larger concentric circle should be sampled at some rate y (y > x)? Since then it feels like we might be able to split up the overall area into more intuitive sections, but still be able to sample "uniformly" under this weighting scheme.