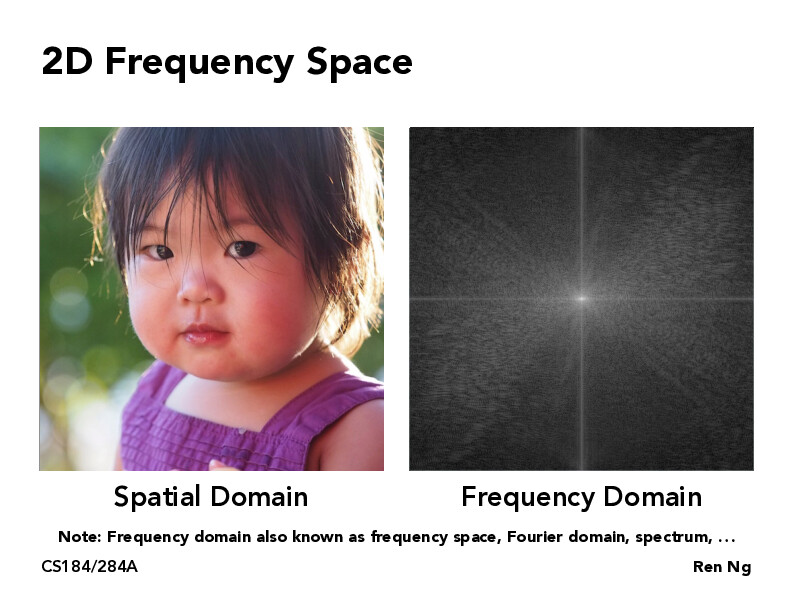
Why is there a cross pattern in the frequency domain?
sberkun
Typically, horizontal lines in the spatial domain show up as vertical lines in the frequency domain, and vice versa (explanation). If you're interested in learning more, I highly recommend this really cool demo, where you can explore the Fourier transform of any image.
I'm actually not sure what the cause of the cross is, but I suspect that it's the edges of the image. You can test this by circularly cropping the image, and putting the cropped version in the aforementioned demo. The cross disappears in the resulting transform.
Staffshubham-goel
Great observation, @starptr. Also, thanks for sharing that demo @sberkun, it's very cool!
You're right that the vertical and horizontal lines are because of edge effects in the image. The Discrete Fourier Transform (DFT) result visualized here assumes the spatial signal is periodic, i.e. the image is tiled horizontally and vertically infinitely many times. Therefore, we see a sharp vertical line in the Fourier domain when the top and bottom edges of the image are very different. Similarly, a horizontal line is seen when the left and right edges of the image are very different.
Based on this, if I cut the image along a vertical line, swap the left and right halves, and paste them together -- how will the Frequency domain change?
adham-elarabawy
A very important connection to make here to highlight the importance of the frequency domain, is to that of MRI imaging. The frequency/fourier domain is often used to disentangle sampling/aliasing issues in MRI's as a result of undersampling (which is done to speed up MRI's which enables a ton of applications like medical imagery of babies that can't stay still long enough for MRI's to work cleanly on them). Understasnding the frequency domain on a fundamental level might allow you to make great breakthroughs in the world of MRI machine learning, which has direct implications on (theoretically) the health and diagnosis of babies! If you're interested in this further, check out Professor Miki Lustig's lab and take a look at some of the work that his lab does in signal processing + Machine learning built off of work in the frequency domain!
starptr
@shubham-goel the horizontal line in the frequency domain is probably more emphasized (there are now 3 vertical edges)
Staffshubham-goel
Not quite, the frequency domain (as visualized here) remains the same! Can you justify why? Imagine tiling the new image horizontally and vertically to create an infinite pattern.
Staffyirenng
@adham-elarabawy Thank you for this comment. I love MRI!
Staffyirenng
Good discussion, folks!
sZwX74
@shubham-goel does it stay the same because even if we tile the image, the "patterns" in the image don't change they're just repeated, and even the edges will remain the same because the top and bottom edges will still remain the top and bottom edges of the new tiling, and the same for left and right edges?
lwg0320
How does color play a role in the conversion between spatial and frequency domain? How does information about color be retained?
JustinHuey1
What is the correlation between the two images? I am having trouble trying to wrap my mind around why the spatial domain image translates to the frequency domain one
sberkun
@lwg0320 the 3 color channels can be thought of as 3 separate images, each with it's own frequency domain. In this slide, the frequency domain shown is probably just the frequency of the grayscale version of this image.
It would be a neat experiment to take the frequency domains of each color channel and combine them into a "colorized" frequency domain plot, I wonder what that would look like.
geos98
@JustinHuey1, I believe this is similar to the 1D Fourier case. You are decomposing the images into different frequencies from different "directions" basically.
Why is there a cross pattern in the frequency domain?
Typically, horizontal lines in the spatial domain show up as vertical lines in the frequency domain, and vice versa (explanation). If you're interested in learning more, I highly recommend this really cool demo, where you can explore the Fourier transform of any image.
I'm actually not sure what the cause of the cross is, but I suspect that it's the edges of the image. You can test this by circularly cropping the image, and putting the cropped version in the aforementioned demo. The cross disappears in the resulting transform.
Great observation, @starptr. Also, thanks for sharing that demo @sberkun, it's very cool!
You're right that the vertical and horizontal lines are because of edge effects in the image. The Discrete Fourier Transform (DFT) result visualized here assumes the spatial signal is periodic, i.e. the image is tiled horizontally and vertically infinitely many times. Therefore, we see a sharp vertical line in the Fourier domain when the top and bottom edges of the image are very different. Similarly, a horizontal line is seen when the left and right edges of the image are very different.
Based on this, if I cut the image along a vertical line, swap the left and right halves, and paste them together -- how will the Frequency domain change?
A very important connection to make here to highlight the importance of the frequency domain, is to that of MRI imaging. The frequency/fourier domain is often used to disentangle sampling/aliasing issues in MRI's as a result of undersampling (which is done to speed up MRI's which enables a ton of applications like medical imagery of babies that can't stay still long enough for MRI's to work cleanly on them). Understasnding the frequency domain on a fundamental level might allow you to make great breakthroughs in the world of MRI machine learning, which has direct implications on (theoretically) the health and diagnosis of babies! If you're interested in this further, check out Professor Miki Lustig's lab and take a look at some of the work that his lab does in signal processing + Machine learning built off of work in the frequency domain!
@shubham-goel the horizontal line in the frequency domain is probably more emphasized (there are now 3 vertical edges)
Not quite, the frequency domain (as visualized here) remains the same! Can you justify why? Imagine tiling the new image horizontally and vertically to create an infinite pattern.
@adham-elarabawy Thank you for this comment. I love MRI!
Good discussion, folks!
@shubham-goel does it stay the same because even if we tile the image, the "patterns" in the image don't change they're just repeated, and even the edges will remain the same because the top and bottom edges will still remain the top and bottom edges of the new tiling, and the same for left and right edges?
How does color play a role in the conversion between spatial and frequency domain? How does information about color be retained?
What is the correlation between the two images? I am having trouble trying to wrap my mind around why the spatial domain image translates to the frequency domain one
@lwg0320 the 3 color channels can be thought of as 3 separate images, each with it's own frequency domain. In this slide, the frequency domain shown is probably just the frequency of the grayscale version of this image.
It would be a neat experiment to take the frequency domains of each color channel and combine them into a "colorized" frequency domain plot, I wonder what that would look like.
@JustinHuey1, I believe this is similar to the 1D Fourier case. You are decomposing the images into different frequencies from different "directions" basically.