What do negative coordinates in the frequency domain mean? I think I'm confused how a frequency can be negative
sberkun
@BrianSantoso the frequency domain can be thought of as a map of which exponentials you need to sum up to reconstruct the original image. iirc, a point (u, v) in the frequency domain represents the function e2πj(ux+vy), where j=√−1.
reinaw1012
Do the colors in the image to the right matter? As in if the two dots on the outside are lighter/darker, does that change our interpretation?
reesiespeesies
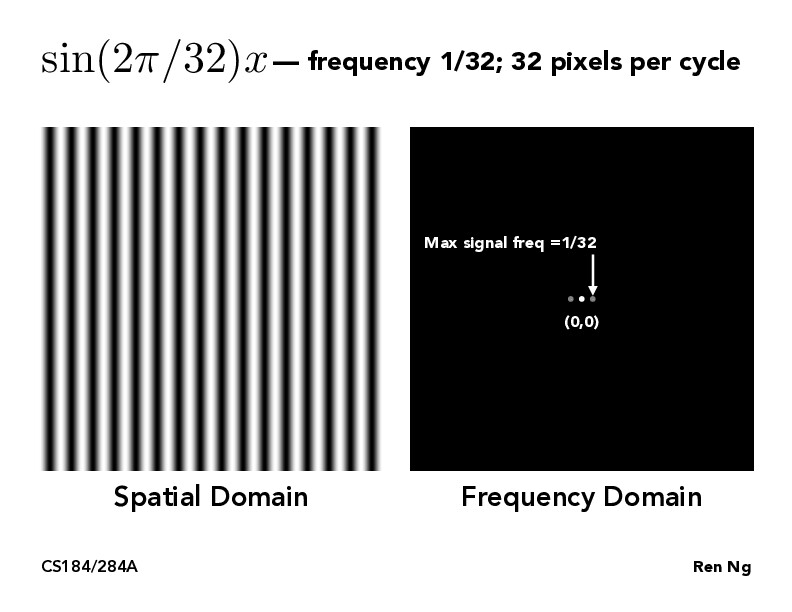
I get that the higher the freq, the further from the origin/center the pixel is in the freq domain, but what do the shades of colors mean in the freq domain? Are the corresponding to usage rates?
jonathanlu31
I'm guessing the color corresponds to the magnitude of the complex fourier coefficient. By inverse Euler's formula you can express sin(x) as the sum of two complex exponentials sin(x)=2ieix−e−ix, so the two dots on either side of (0,0) would have magnitude 1/2 but I'm not sure why (0,0) has such high intensity. Maybe there's a constant shift? I'm not too sure.
Staffshubham-goel
Great discussion, folks! @jonathanlu31 is right, the color of the dots in the frequency domain signals the amplitude of the corresponding sin/cos/exponential functions, and the center dot is a constant shift.
As for why is a constant shift needed and why is the center dot brighter -- perhaps it has something to do with the range of sin(x)∈[−1,1], and the image on the left ([0,1])?
Staffyirenng
Good discussion, folks! And yes, the center dot in the frequency domain is so that the the function on the left has positive values.
adityasingh7311
It's not obvious to me how the sinusoidal function translates into a spatial domain image. It is intuitive that as you traverse along the x-axis of the image, when you are inside one color region/column there is less image frequency since the color is not changing then as you approach the border of the next color region/column the frequency goes up, peaking when the color transitions to the next color.
But what does this mean in terms of mathematical coordinates? Like, if I have that sine function how do I plot it into that spatial domain image?
What do negative coordinates in the frequency domain mean? I think I'm confused how a frequency can be negative
@BrianSantoso the frequency domain can be thought of as a map of which exponentials you need to sum up to reconstruct the original image. iirc, a point (u, v) in the frequency domain represents the function e2πj(ux+vy), where j=√−1.
Do the colors in the image to the right matter? As in if the two dots on the outside are lighter/darker, does that change our interpretation?
I get that the higher the freq, the further from the origin/center the pixel is in the freq domain, but what do the shades of colors mean in the freq domain? Are the corresponding to usage rates?
I'm guessing the color corresponds to the magnitude of the complex fourier coefficient. By inverse Euler's formula you can express sin(x) as the sum of two complex exponentials sin(x)=2ieix−e−ix, so the two dots on either side of (0,0) would have magnitude 1/2 but I'm not sure why (0,0) has such high intensity. Maybe there's a constant shift? I'm not too sure.
Great discussion, folks! @jonathanlu31 is right, the color of the dots in the frequency domain signals the amplitude of the corresponding sin/cos/exponential functions, and the center dot is a constant shift.
As for why is a constant shift needed and why is the center dot brighter -- perhaps it has something to do with the range of sin(x)∈[−1,1], and the image on the left ([0,1])?
Good discussion, folks! And yes, the center dot in the frequency domain is so that the the function on the left has positive values.
It's not obvious to me how the sinusoidal function translates into a spatial domain image. It is intuitive that as you traverse along the x-axis of the image, when you are inside one color region/column there is less image frequency since the color is not changing then as you approach the border of the next color region/column the frequency goes up, peaking when the color transitions to the next color.
But what does this mean in terms of mathematical coordinates? Like, if I have that sine function how do I plot it into that spatial domain image?