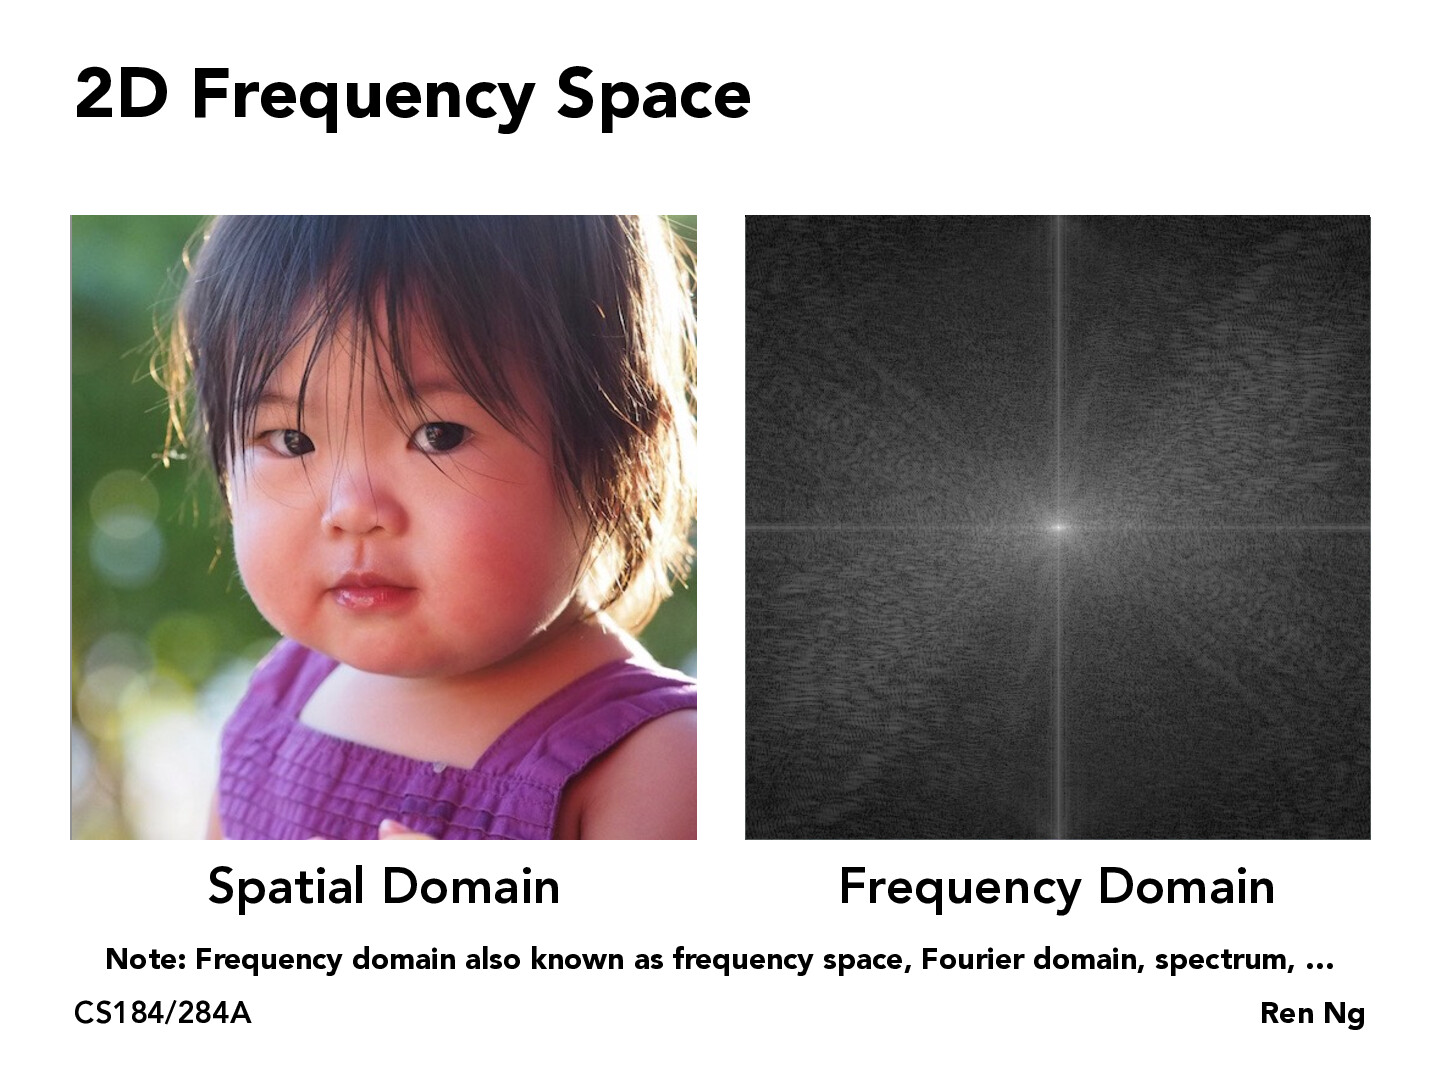
It's good to clarify that we're using the 2D Fourier Transform to produce the frequency domain, and each point represents a different sinusoid. See https://www.cs.unm.edu/~brayer/vision/fourier.html.
myxamediyar
I agree with the previous comment. I personally have a limited signals background, so the concept of decomposing an image into frequencies was new to me. The fact that the frequency domain of an image captures both the vertical and horizontal frequencies and represents that a signal could vary a lot say on the y-axis but not as much on the x-axis or vise versa is very interesting.
stang085
Is there a formal definition of what a frequency domain is and what it does?
agao25
@stang085 My understanding is that the frequency domain is just a different representation for continuous changing functions of time. I am also a bit confused about frequency domains in 2D and trying to wrap my head around it, but at least for a 1D visualization of spatial/time? to frequency domain, the first image at this link has helped me before.
For frequency domain, bright spots correspond to frequencies that are prevalent in the image, while darker areas represent less common frequencies.
llejj
I feel like the frequency domain representation is less efficient, since there might be infinite frequencies? But in the slide, it seems like the frequency domain is the same size as the spatial domain
It's good to clarify that we're using the 2D Fourier Transform to produce the frequency domain, and each point represents a different sinusoid. See https://www.cs.unm.edu/~brayer/vision/fourier.html.
I agree with the previous comment. I personally have a limited signals background, so the concept of decomposing an image into frequencies was new to me. The fact that the frequency domain of an image captures both the vertical and horizontal frequencies and represents that a signal could vary a lot say on the y-axis but not as much on the x-axis or vise versa is very interesting.
Is there a formal definition of what a frequency domain is and what it does?
@stang085 My understanding is that the frequency domain is just a different representation for continuous changing functions of time. I am also a bit confused about frequency domains in 2D and trying to wrap my head around it, but at least for a 1D visualization of spatial/time? to frequency domain, the first image at this link has helped me before.
https://insightincmiami.org/data-visualization-using-the-fourier-transform/
For frequency domain, bright spots correspond to frequencies that are prevalent in the image, while darker areas represent less common frequencies.
I feel like the frequency domain representation is less efficient, since there might be infinite frequencies? But in the slide, it seems like the frequency domain is the same size as the spatial domain