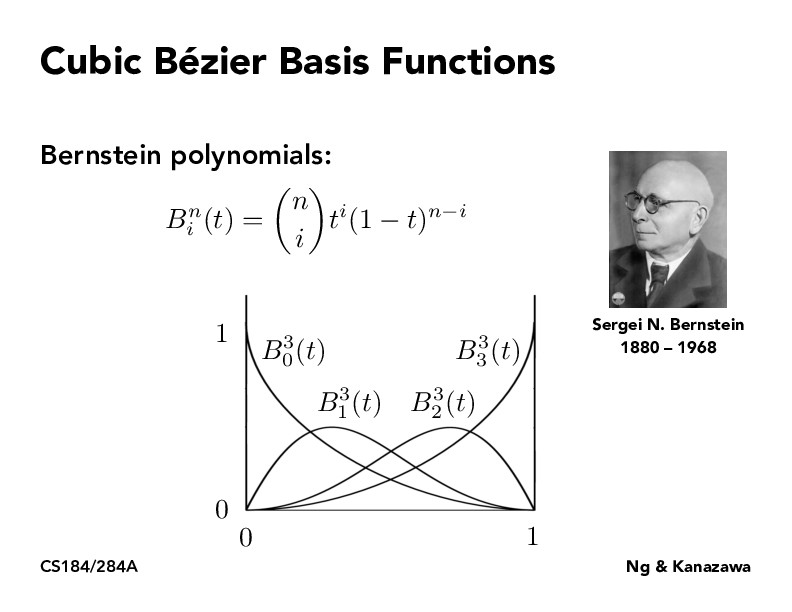
I notice that the Bernstein polynomial distribution is exactly the same formula as the binomial distribution from CS70 and EECS126, but I never knew that there was a visual graph associated with it! I can't really connect how these curves represent "the number of successes in a series of n experiments" however...
I notice that the Bernstein polynomial distribution is exactly the same formula as the binomial distribution from CS70 and EECS126, but I never knew that there was a visual graph associated with it! I can't really connect how these curves represent "the number of successes in a series of n experiments" however...