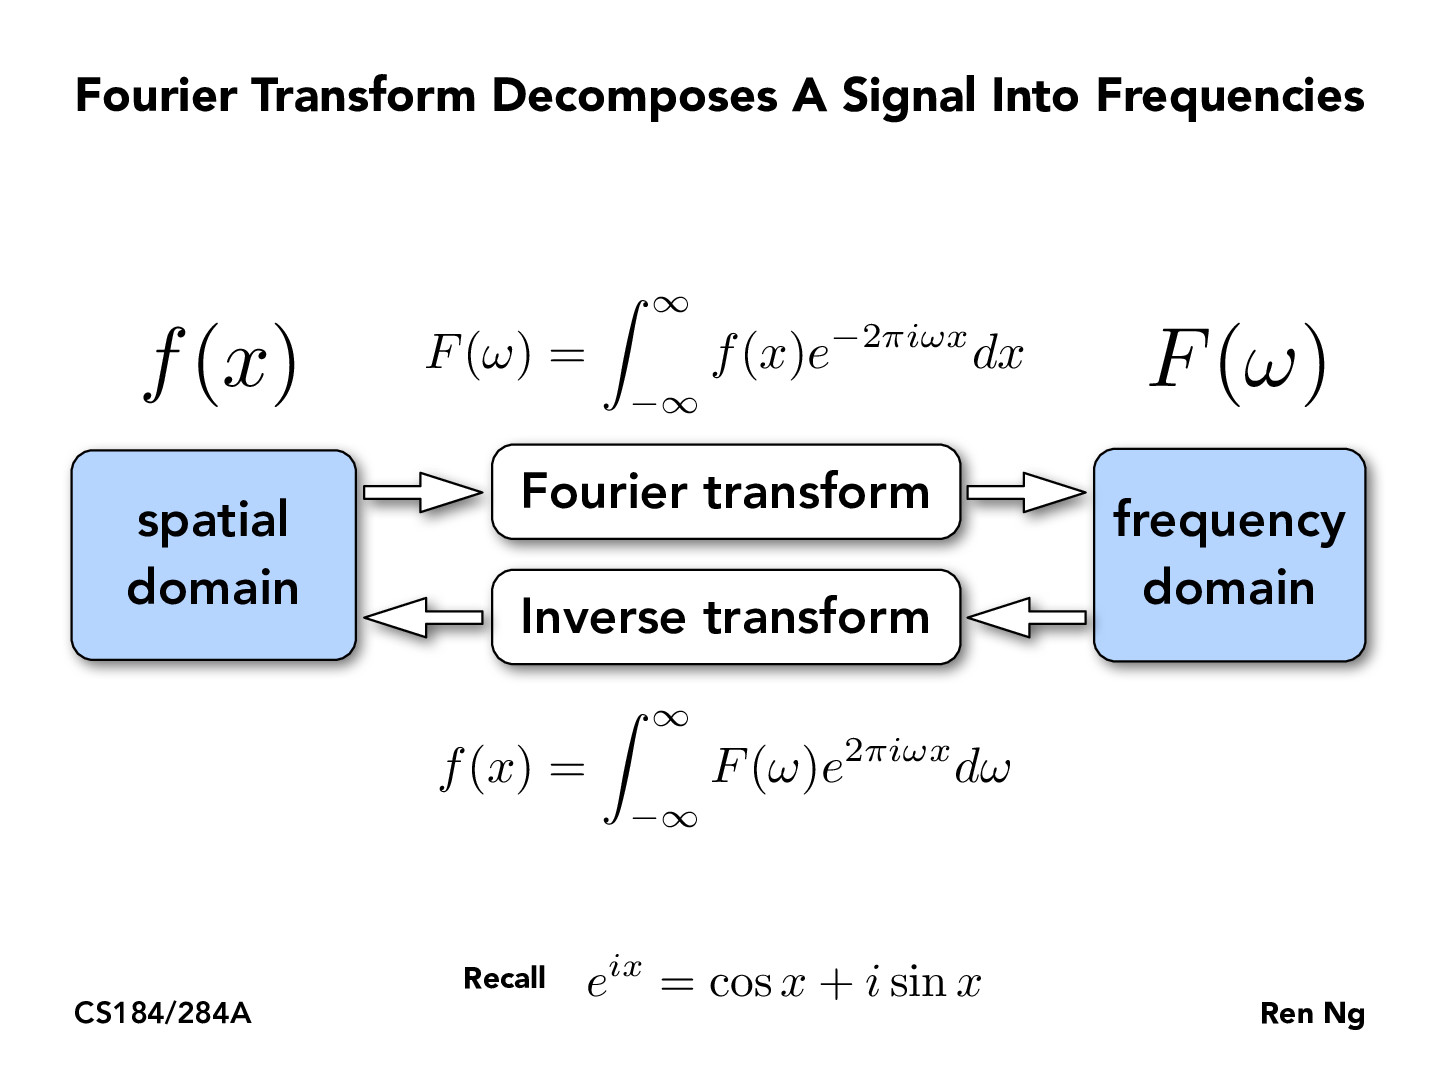
The Fourier Transform could be regarded as a selector or projector from temporal signal to specific sin functions with different frequencies.
For example, if ω=1, only the signal with the same frequency 1 will remain after the integration, signal (energy) with other freqs with integration from -inf to inf with a periodical etω is just zero.
So F(ω) is the spectrum of frequency of the original signal. FT also preserves the energy since the magnitude of the signal is identical.
In computers, we usually apply fast FT called FFT. We need to select the base sampling period and frequency. In the image, the base sampling period (resolution) is just 1 pixel.
NKJEW
One of my favorite visual intuitions on the why the Fourier Transform is what it is and how the math ties into this conceptual explanation has to be from the math channel 3BBlue1Brown. His video on the subject, as well as his videos in general, pair animation with examples really well in my opinion, and I'd highly recommend them to anyone interested.
Although I've seen this channel makes the rounds in any class that's even vaguely linear algebra related anyhow so this might just be common knowledge.
micahtyong
To add onto this, my friend gave a thoughtful explanation of how fast fourier transforms directly apply to image compression here––which seems to be an application hinted at throughout the lecture.
He uses 3Blue1Brown's animation library, Manim, which does a beautiful job visualizing topics such as FFT and convolution.
BohanYu
As an add up to 3blue1brown, here is a very good intuition-building (without getting too much into the detail) video of what Fourier series actually does.
https://www.youtube.com/watch?v=r6sGWTCMz2k&ab_channel=3Blue1Brown
The Fourier Transform could be regarded as a selector or projector from temporal signal to specific sin functions with different frequencies.
For example, if ω=1, only the signal with the same frequency 1 will remain after the integration, signal (energy) with other freqs with integration from -inf to inf with a periodical etω is just zero.
So F(ω) is the spectrum of frequency of the original signal. FT also preserves the energy since the magnitude of the signal is identical.
In computers, we usually apply fast FT called FFT. We need to select the base sampling period and frequency. In the image, the base sampling period (resolution) is just 1 pixel.
One of my favorite visual intuitions on the why the Fourier Transform is what it is and how the math ties into this conceptual explanation has to be from the math channel 3BBlue1Brown. His video on the subject, as well as his videos in general, pair animation with examples really well in my opinion, and I'd highly recommend them to anyone interested.
Although I've seen this channel makes the rounds in any class that's even vaguely linear algebra related anyhow so this might just be common knowledge.
To add onto this, my friend gave a thoughtful explanation of how fast fourier transforms directly apply to image compression here––which seems to be an application hinted at throughout the lecture.
He uses 3Blue1Brown's animation library, Manim, which does a beautiful job visualizing topics such as FFT and convolution.
As an add up to 3blue1brown, here is a very good intuition-building (without getting too much into the detail) video of what Fourier series actually does. https://www.youtube.com/watch?v=r6sGWTCMz2k&ab_channel=3Blue1Brown