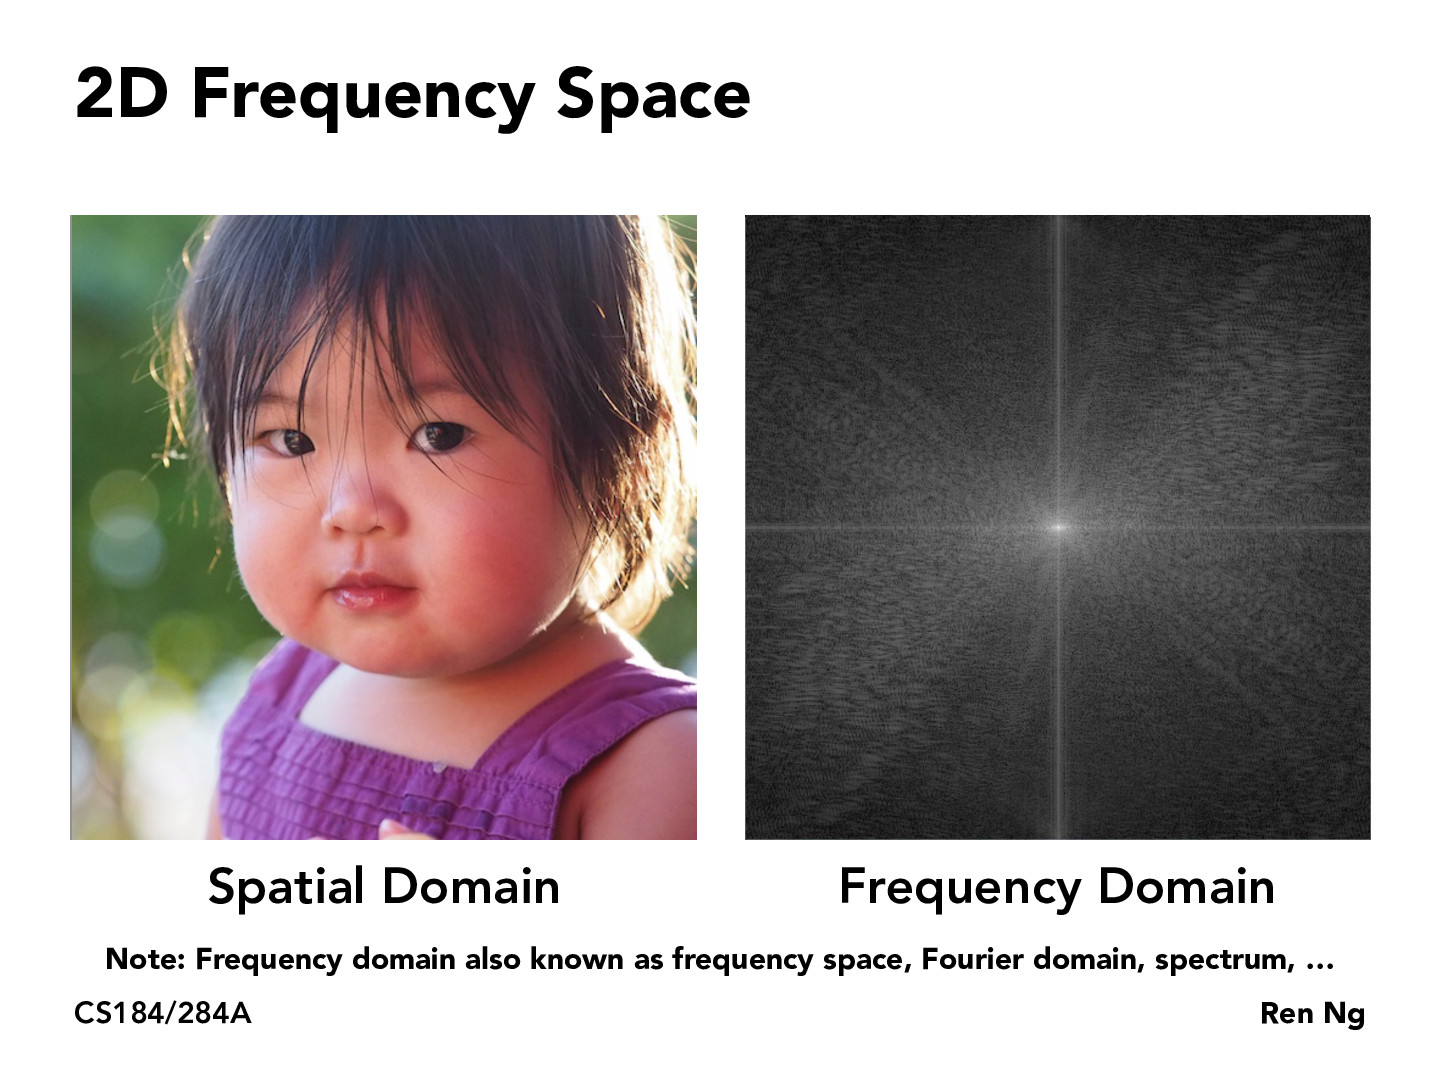
For anyone having a hard time visualizing how a 2D frequency domain image can represent the spatial domain image, this video was really useful: youtube (Credits to Professor Austin Roorda for showing this in VS260A). The video consecutively adds all the sinusoidal gratings from low frequency to high frequency to build the full spatial image.
Staffajayjain
Great resource, thanks for sharing @imjal!
sinood
Why do we visualize the frequency domain images? I understand that the fourier/frequency domain helps compress the image since we can recover the original image using inverse transform; but do we ever make use of the visualizations such as the one on the right of this slide?
Waterstar1
I thought the frequency domain was simply used for mathematic calculations. I've learned about the Fourier transform in a few other classes (notably physics), but I also have never seen a visualization such as the one shown on the right. I actually do think it's helpful to understand the concept, however. Perhaps it's usually simply used as a teaching mechanism?
For anyone having a hard time visualizing how a 2D frequency domain image can represent the spatial domain image, this video was really useful: youtube (Credits to Professor Austin Roorda for showing this in VS260A). The video consecutively adds all the sinusoidal gratings from low frequency to high frequency to build the full spatial image.
Great resource, thanks for sharing @imjal!
Why do we visualize the frequency domain images? I understand that the fourier/frequency domain helps compress the image since we can recover the original image using inverse transform; but do we ever make use of the visualizations such as the one on the right of this slide?
I thought the frequency domain was simply used for mathematic calculations. I've learned about the Fourier transform in a few other classes (notably physics), but I also have never seen a visualization such as the one shown on the right. I actually do think it's helpful to understand the concept, however. Perhaps it's usually simply used as a teaching mechanism?