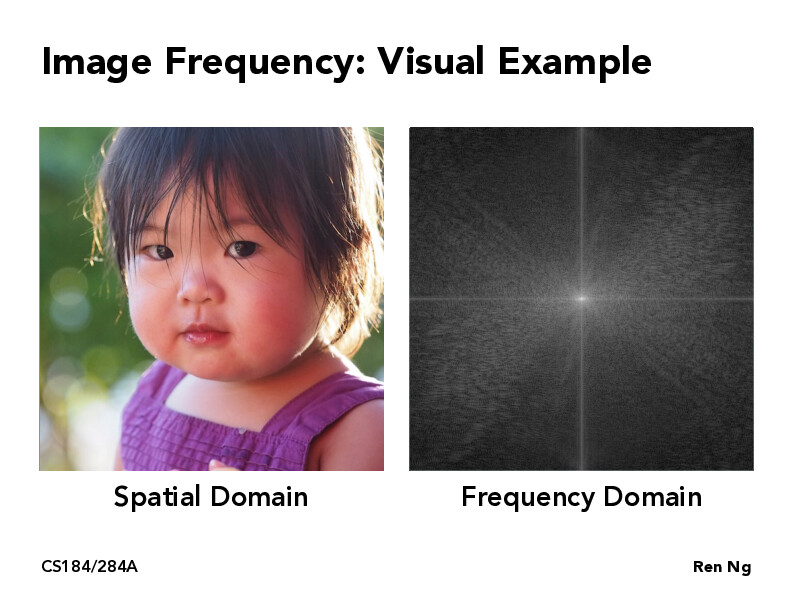
The values in the frequency domain are actually complex and have imaginary components. This figure on the right shows the magnitude of the frequency domain.
ChangyiYang
Here is a question that came to my mind during the lecture. I can understand, in the Frequency Domain picture, what the points on the x and y axis represent. But how should I understand the points not in the x and y axis? Is that represent the frequency in that direction? Such as Point (1,1), is that represent the frequency in the northeast direction?
The values in the frequency domain are actually complex and have imaginary components. This figure on the right shows the magnitude of the frequency domain.
Here is a question that came to my mind during the lecture. I can understand, in the Frequency Domain picture, what the points on the x and y axis represent. But how should I understand the points not in the x and y axis? Is that represent the frequency in that direction? Such as Point (1,1), is that represent the frequency in the northeast direction?