What does maximum signal frequency represent here?
Staffashchu
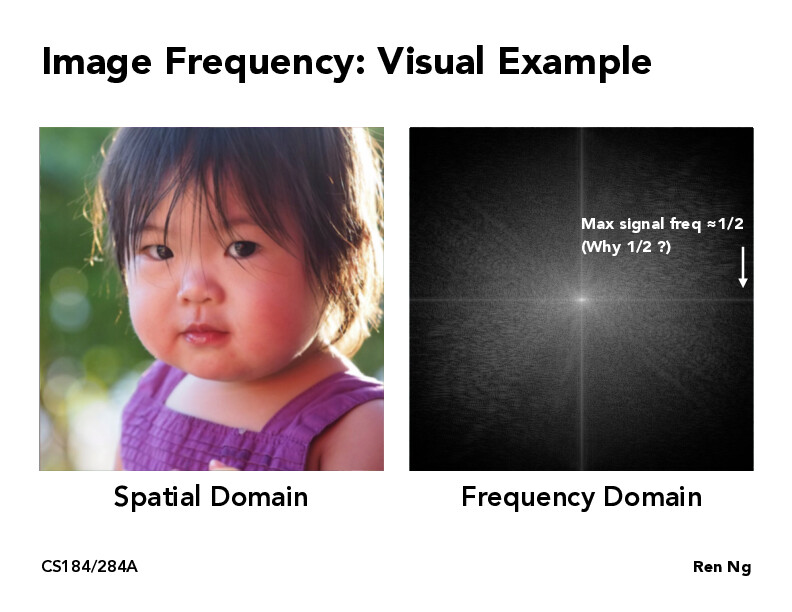
@jzhou1318 Good question! The maximum signal frequency labelled here is the Nyquist frequency of the image.
In this slide, every pixel in the image is a sample, so the sampling rate is 1 sample per pixel. Thus, the Nyquist frequency is 1/2 the sampling rate (1/2*1 = 1/2). The Nyquist frequency
in the frequency domain represents the max frequency with the furthest distance from the origin.
You can think of frequencies as the edges or changes between pixel values of the image. There's a higher amount of frequencies when pixel values are quickly changing. In terms of why the spectrum is so spread out, this is because of the high amount of frequencies in the image. The image right now is pretty clear and have starker changes between pixels, but if we blurred the image, what would happen? For example, pixel values in sharper images have higher frequencies than non-sharpened images.
As some more food for thought, when we blur an image, how do you think this impacts the frequencies in our signal and the Nyquist frequency?
sZwX74
@ashchu It should cap/cut off the higher end of our frequencies, so we the frequencies in our signal and the Nyquist frequency should decrease. Visually, you can think of it as the frequency domain graph not extending all the way to the edges like shown here. Is this correct?
What does maximum signal frequency represent here?
@jzhou1318 Good question! The maximum signal frequency labelled here is the Nyquist frequency of the image.
In this slide, every pixel in the image is a sample, so the sampling rate is 1 sample per pixel. Thus, the Nyquist frequency is 1/2 the sampling rate (1/2*1 = 1/2). The Nyquist frequency in the frequency domain represents the max frequency with the furthest distance from the origin.
You can think of frequencies as the edges or changes between pixel values of the image. There's a higher amount of frequencies when pixel values are quickly changing. In terms of why the spectrum is so spread out, this is because of the high amount of frequencies in the image. The image right now is pretty clear and have starker changes between pixels, but if we blurred the image, what would happen? For example, pixel values in sharper images have higher frequencies than non-sharpened images.
As some more food for thought, when we blur an image, how do you think this impacts the frequencies in our signal and the Nyquist frequency?
@ashchu It should cap/cut off the higher end of our frequencies, so we the frequencies in our signal and the Nyquist frequency should decrease. Visually, you can think of it as the frequency domain graph not extending all the way to the edges like shown here. Is this correct?