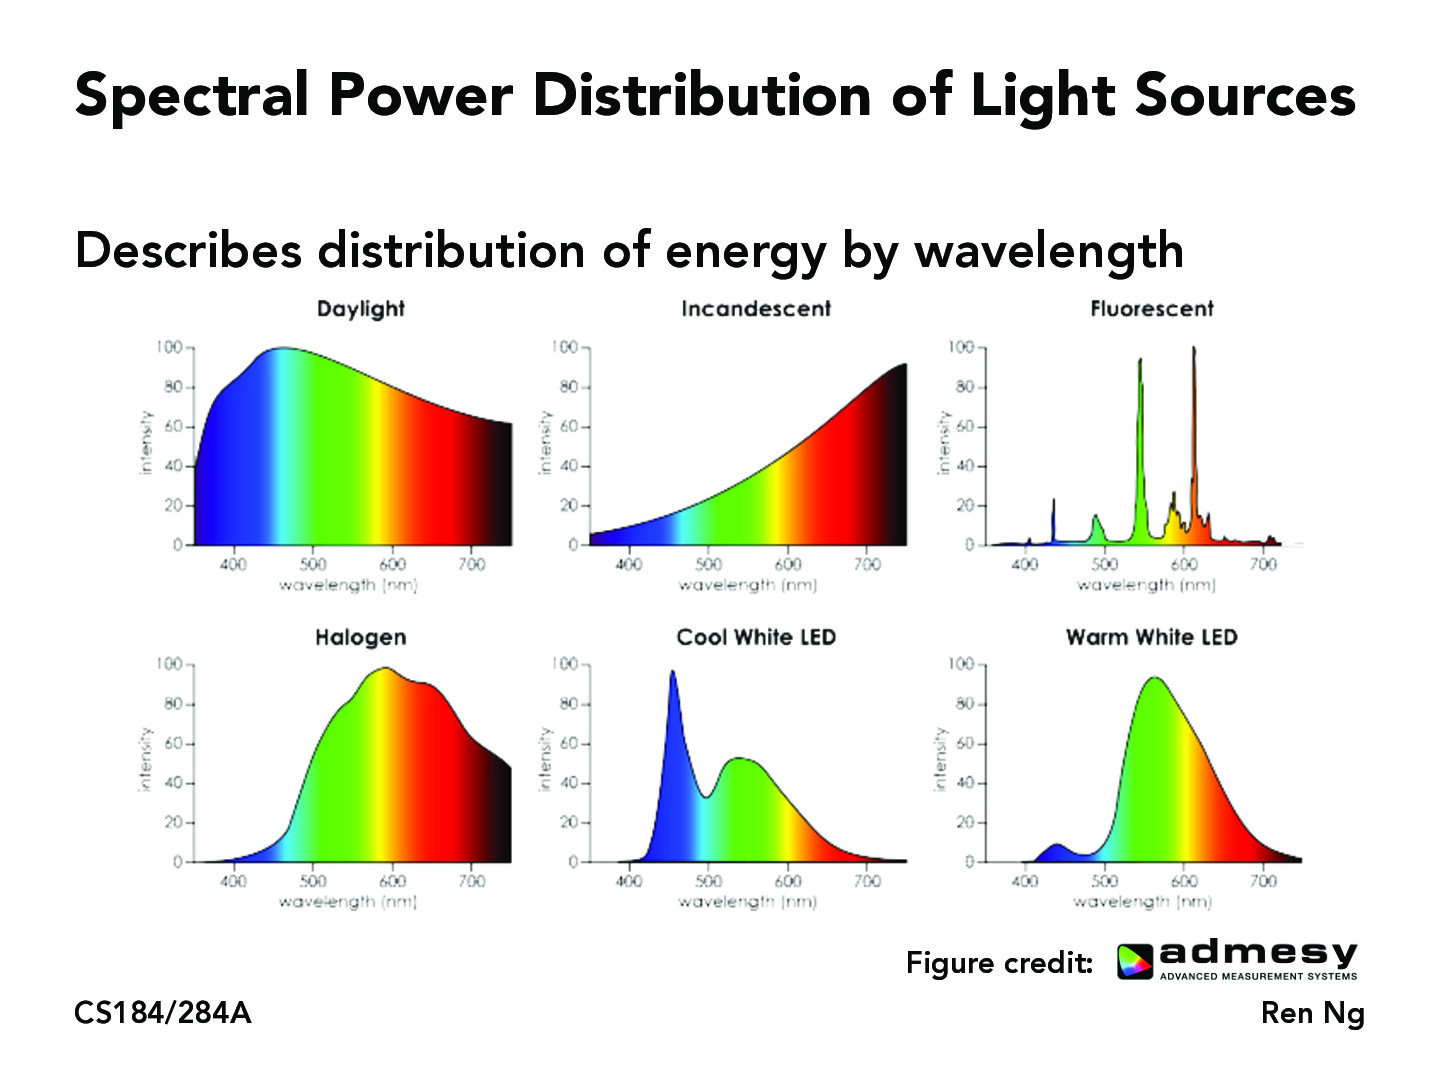
Does the CDF or PDF of these distributions mean anything meaningful? This is very interesting to me. Does it apply to non-visible colors as well? Why is the Fluorescent light's distribution so weird? How smooth are these in reality (are they more noisy than the diagram suggests)? I have so many questions.
AlsonC
Also wondering the same as @willrothsman , why are some distributions skewed a certain way, does it have to do with the physical properties of the light.
J1ungle
Our eyes have evolved to adjust to daylight, which typically has a peak in blue and green light wavelengths. Consequently, if an LED's spectral power distribution closely resembles that of daylight, does this implies that the LED could achieve comparable brightness levels with reduced power consumption?
spegeerino
@wilrothman The fluorescent light has such a weird distribution because it generates light in a unique way compared to most light sources we use. (Disclaimer: this is middle school physics I barely remember, so this could be somewhat or entirely wrong; please correct me if you notice something wrong.) Fluorescent light bulbs are filled with a gas (usually argon with a small amount of mercury vapor), which then has current induced across it, which makes the gases emit UV light. This UV light in turn hits a coating of phosphor on the inner surface of the lights; this causes electrons in the phosphor to be excited into higher orbits, but the energy used to do so doesn't take the whole energy of the photon hitting the electron. So, the electron emits another photon with lower energy, in the visible range (so that energy is conserved).
Some of these transitions of electrons from lower orbits to higher orbits are more likely, which leads to more likely photons to be emitted from the phosphor after one of its electrons is excited. In general, emission, absorption, and excitation spectra are not very smooth, which comes from the fact that changing electron orbitals takes a very specific amount of energy every time, and the fluorescent light spectrum is just a special case of that. That's why fluorescent light is so weird.
myxamediyar
The visualization of spectral power distribution in this image is fascinating! It's intriguing how each light source posses a unique energy signature — almost like fingerprints of light. The sharp peaks in the fluorescent graph and LEDs are also very interesting!
brianqch
I wonder if this explains why in different types of lighting conditions, objects will appear in different colors. I noticed this when playing around with lighting. For example, imagine a blue and red cube on a desk lit by a desk lamp. If the lamp was yellow, the blue cube would look like a dark shade of green. If the cube was blue, the red would look like a dark shade of purple.
Does the CDF or PDF of these distributions mean anything meaningful? This is very interesting to me. Does it apply to non-visible colors as well? Why is the Fluorescent light's distribution so weird? How smooth are these in reality (are they more noisy than the diagram suggests)? I have so many questions.
Also wondering the same as @willrothsman , why are some distributions skewed a certain way, does it have to do with the physical properties of the light.
Our eyes have evolved to adjust to daylight, which typically has a peak in blue and green light wavelengths. Consequently, if an LED's spectral power distribution closely resembles that of daylight, does this implies that the LED could achieve comparable brightness levels with reduced power consumption?
@wilrothman The fluorescent light has such a weird distribution because it generates light in a unique way compared to most light sources we use. (Disclaimer: this is middle school physics I barely remember, so this could be somewhat or entirely wrong; please correct me if you notice something wrong.) Fluorescent light bulbs are filled with a gas (usually argon with a small amount of mercury vapor), which then has current induced across it, which makes the gases emit UV light. This UV light in turn hits a coating of phosphor on the inner surface of the lights; this causes electrons in the phosphor to be excited into higher orbits, but the energy used to do so doesn't take the whole energy of the photon hitting the electron. So, the electron emits another photon with lower energy, in the visible range (so that energy is conserved). Some of these transitions of electrons from lower orbits to higher orbits are more likely, which leads to more likely photons to be emitted from the phosphor after one of its electrons is excited. In general, emission, absorption, and excitation spectra are not very smooth, which comes from the fact that changing electron orbitals takes a very specific amount of energy every time, and the fluorescent light spectrum is just a special case of that. That's why fluorescent light is so weird.
The visualization of spectral power distribution in this image is fascinating! It's intriguing how each light source posses a unique energy signature — almost like fingerprints of light. The sharp peaks in the fluorescent graph and LEDs are also very interesting!
I wonder if this explains why in different types of lighting conditions, objects will appear in different colors. I noticed this when playing around with lighting. For example, imagine a blue and red cube on a desk lit by a desk lamp. If the lamp was yellow, the blue cube would look like a dark shade of green. If the cube was blue, the red would look like a dark shade of purple.