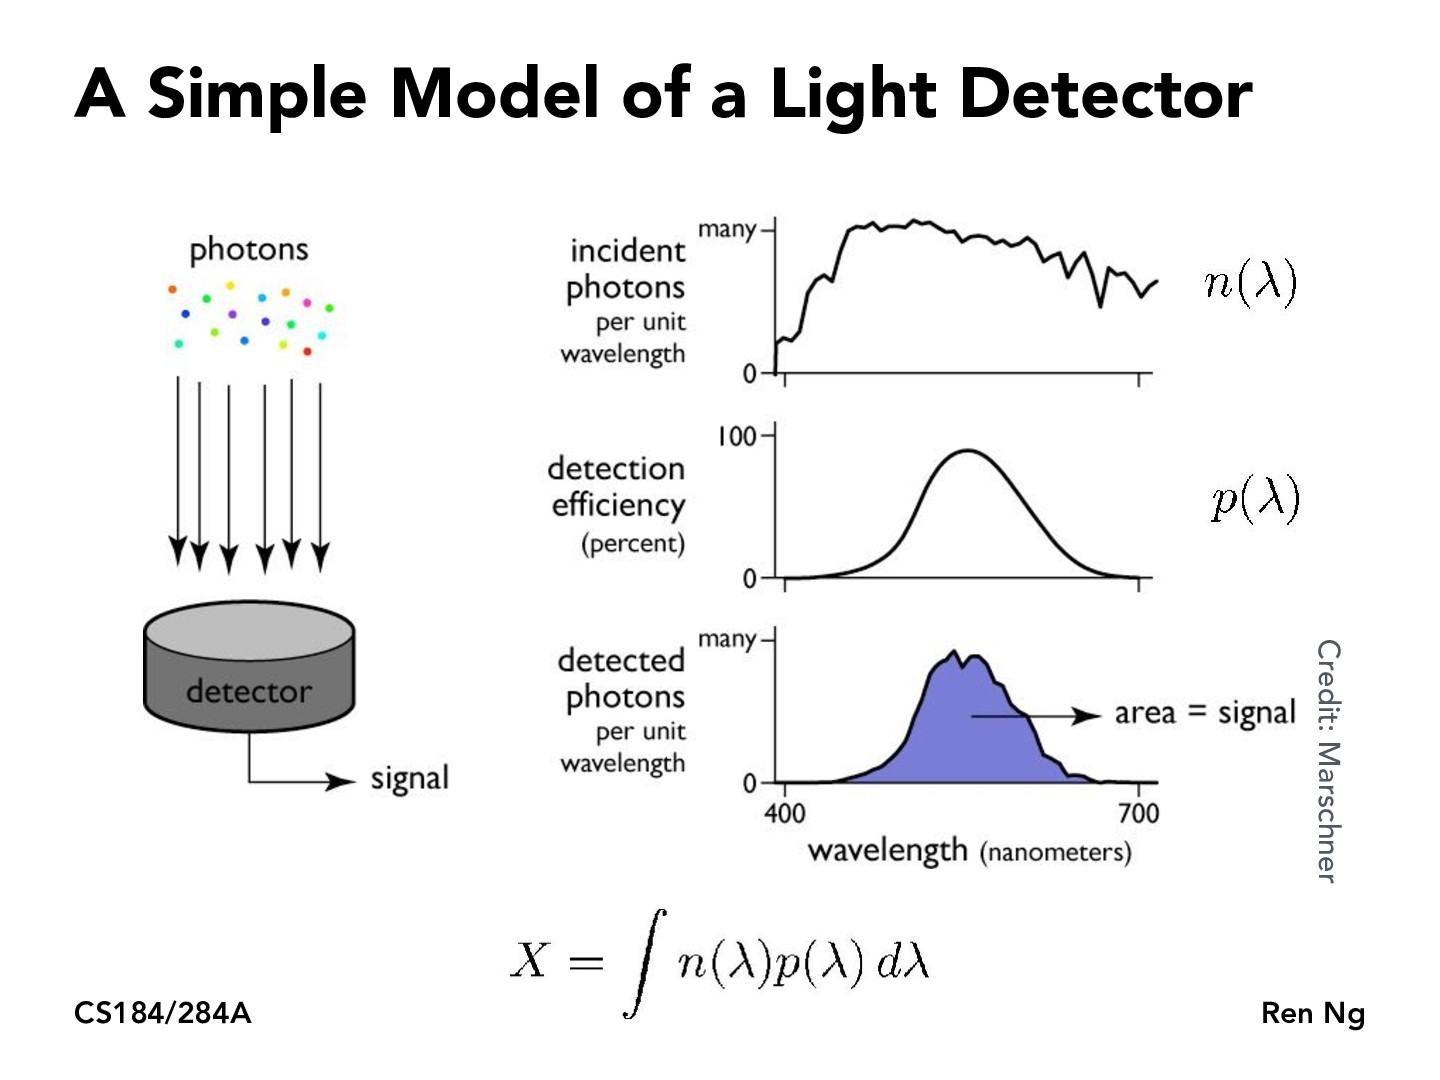
What do the following graphs show exactly? Besides measure the incident and detected photos per each wavelength, is there a significance to the shapes of the curves?
moridin22
I think these graphs are particular to the detector that this example comes from. In terms of the shapes of the curves, you probably want the first two curves to be about the same so that you most efficiently detect the most common wavelengths, similar to how we wanted to use a sampling distribution that resembled the real distribution for Monte Carlo integration.
Carpetfizz
If the light detector cannot discriminate between wavelengths, how are we able to get the function n(λ) ? I'm guessing p(λ) comes from some prior knowledge of the distribution?
EDIT: After thinking about it more, I realized that this describes a "forward model" of the detector, and X is the detector output. The integral just describes how its modeled assuming that we have access to those aforementioned functions.
What do the following graphs show exactly? Besides measure the incident and detected photos per each wavelength, is there a significance to the shapes of the curves?
I think these graphs are particular to the detector that this example comes from. In terms of the shapes of the curves, you probably want the first two curves to be about the same so that you most efficiently detect the most common wavelengths, similar to how we wanted to use a sampling distribution that resembled the real distribution for Monte Carlo integration.
If the light detector cannot discriminate between wavelengths, how are we able to get the function n(λ) ? I'm guessing p(λ) comes from some prior knowledge of the distribution?
EDIT: After thinking about it more, I realized that this describes a "forward model" of the detector, and X is the detector output. The integral just describes how its modeled assuming that we have access to those aforementioned functions.