Lecture 20: Introduction to Color Science (Cont) (49)
x-fa19
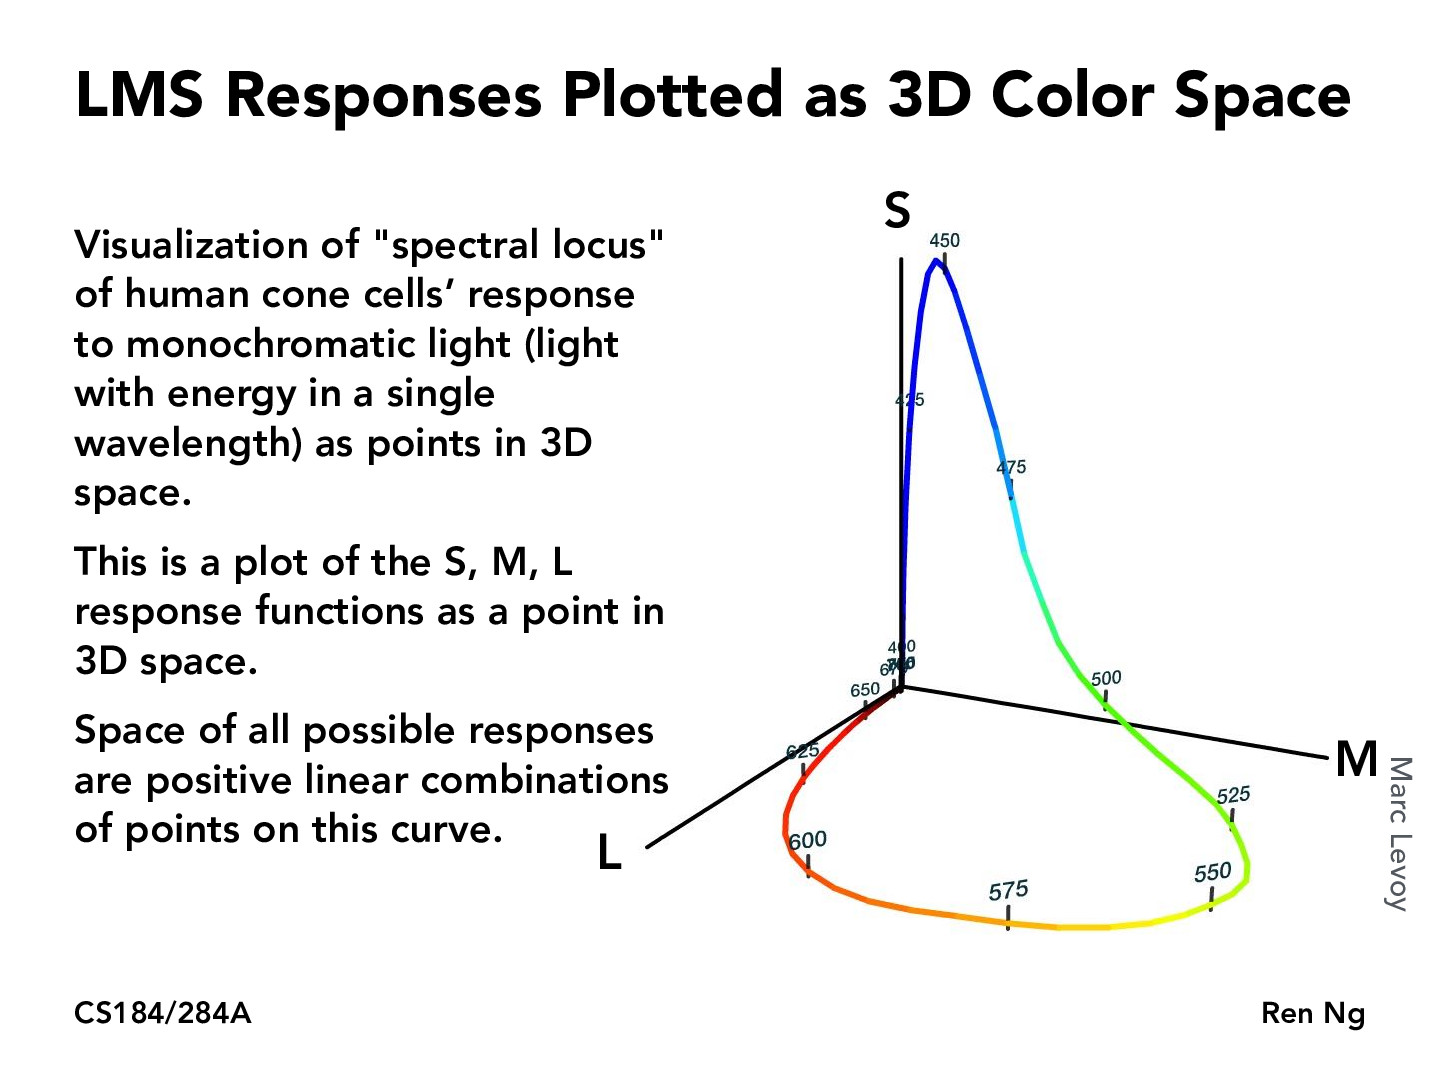
As pointed out in lecture, this 3D plot holds a particular property: the plotted LMS responses do not approach the M-axis. This is because when we look at the previous graphs, we notice that the responses of the M cone cell fall within range of the L, S values --that is to say, there is no point at which the wavelength only stimulates the M cone cell, and not the L, S cells.
As pointed out in lecture, this 3D plot holds a particular property: the plotted LMS responses do not approach the M-axis. This is because when we look at the previous graphs, we notice that the responses of the M cone cell fall within range of the L, S values --that is to say, there is no point at which the wavelength only stimulates the M cone cell, and not the L, S cells.