prof. ng notes that we don't necessarily have to split on the x axis, then the y axis, etc (on average this tends to be good so we don't end up with "strips") in a golden ratio spiral fashion. instead, we can test to see which axis gives us the best split, i.e by the number of objects on each side of the split.
kbiesiadecki141
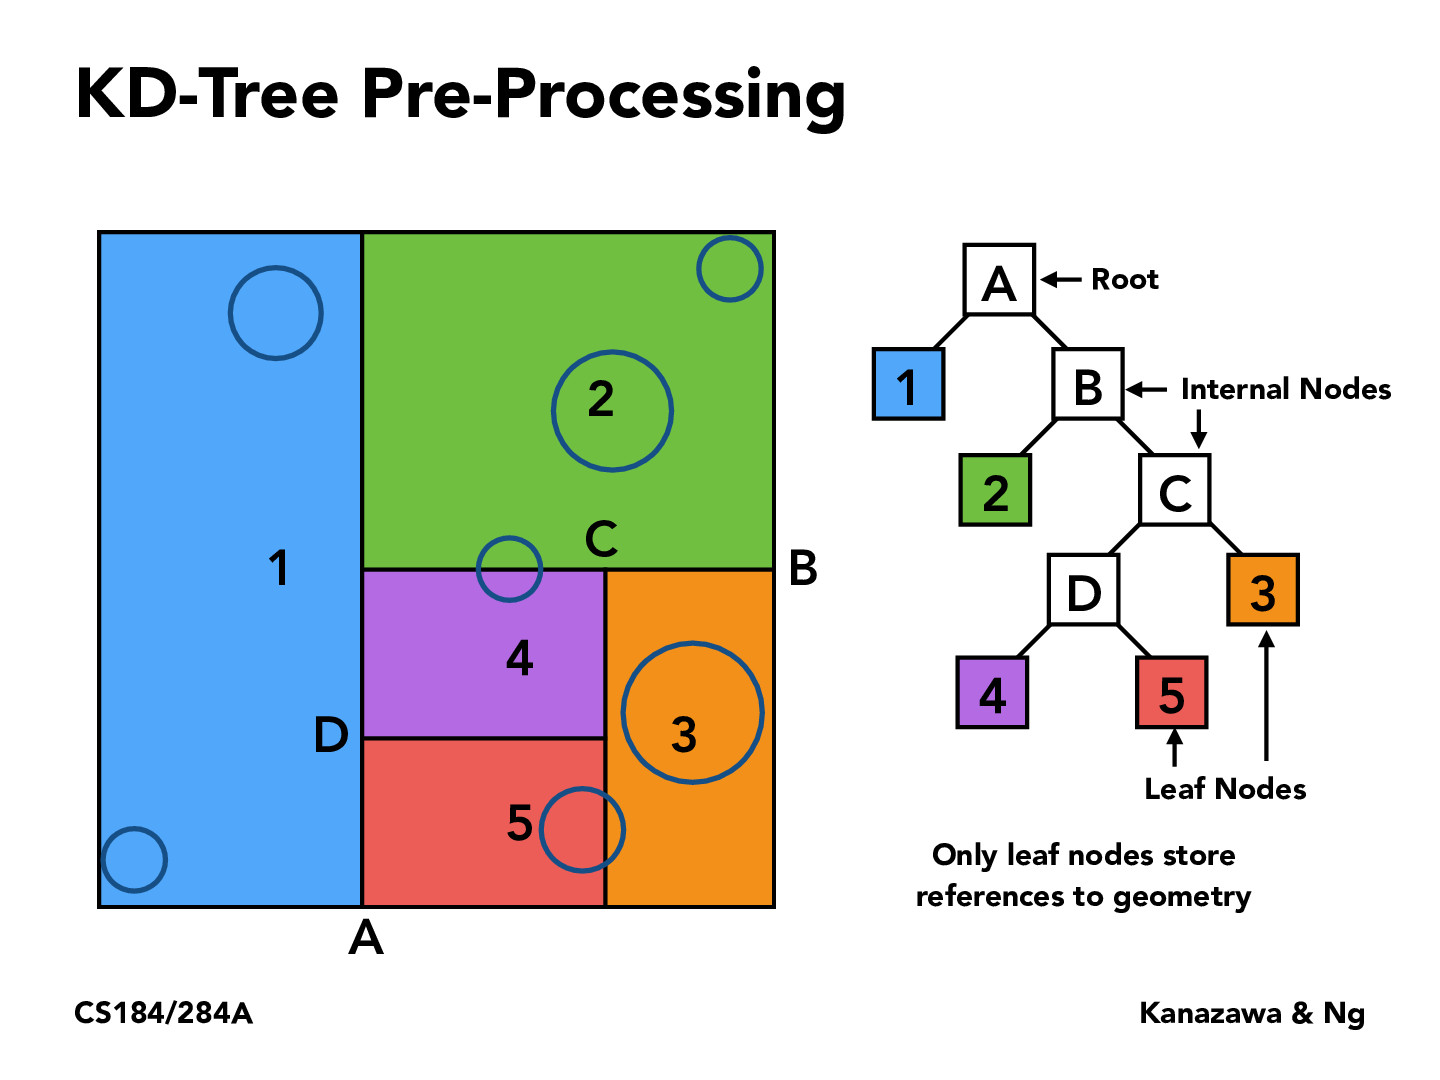
Sorry, I’m having some trouble understanding the figure and how the labels ABCD are determined
herojelly
ABCD are the split locations, so A splits the first box into space (1) and (2, 3, 4, 5). Then, B splits (2, 3, 4, 5) into (2) and (3, 4, 5). Then, C splits (3, 4, 5) into (3) and (4, 5), etc. The tree structure on the right is another way of expressing this.
catherinecang
Do KD trees here aim to have an equal number of objects on each side? Or moreso an equal amount of space on each side? Wondering this because it looks like the original split splits it such that there's 2 on the left and 5 on the right
j316chuck
I think KD trees are split by the median element along a plane which should create an equal number of objects on each side in the average case!
prof. ng notes that we don't necessarily have to split on the x axis, then the y axis, etc (on average this tends to be good so we don't end up with "strips") in a golden ratio spiral fashion. instead, we can test to see which axis gives us the best split, i.e by the number of objects on each side of the split.
Sorry, I’m having some trouble understanding the figure and how the labels ABCD are determined
ABCD are the split locations, so A splits the first box into space (1) and (2, 3, 4, 5). Then, B splits (2, 3, 4, 5) into (2) and (3, 4, 5). Then, C splits (3, 4, 5) into (3) and (4, 5), etc. The tree structure on the right is another way of expressing this.
Do KD trees here aim to have an equal number of objects on each side? Or moreso an equal amount of space on each side? Wondering this because it looks like the original split splits it such that there's 2 on the left and 5 on the right
I think KD trees are split by the median element along a plane which should create an equal number of objects on each side in the average case!
How to decide where to make the splits?