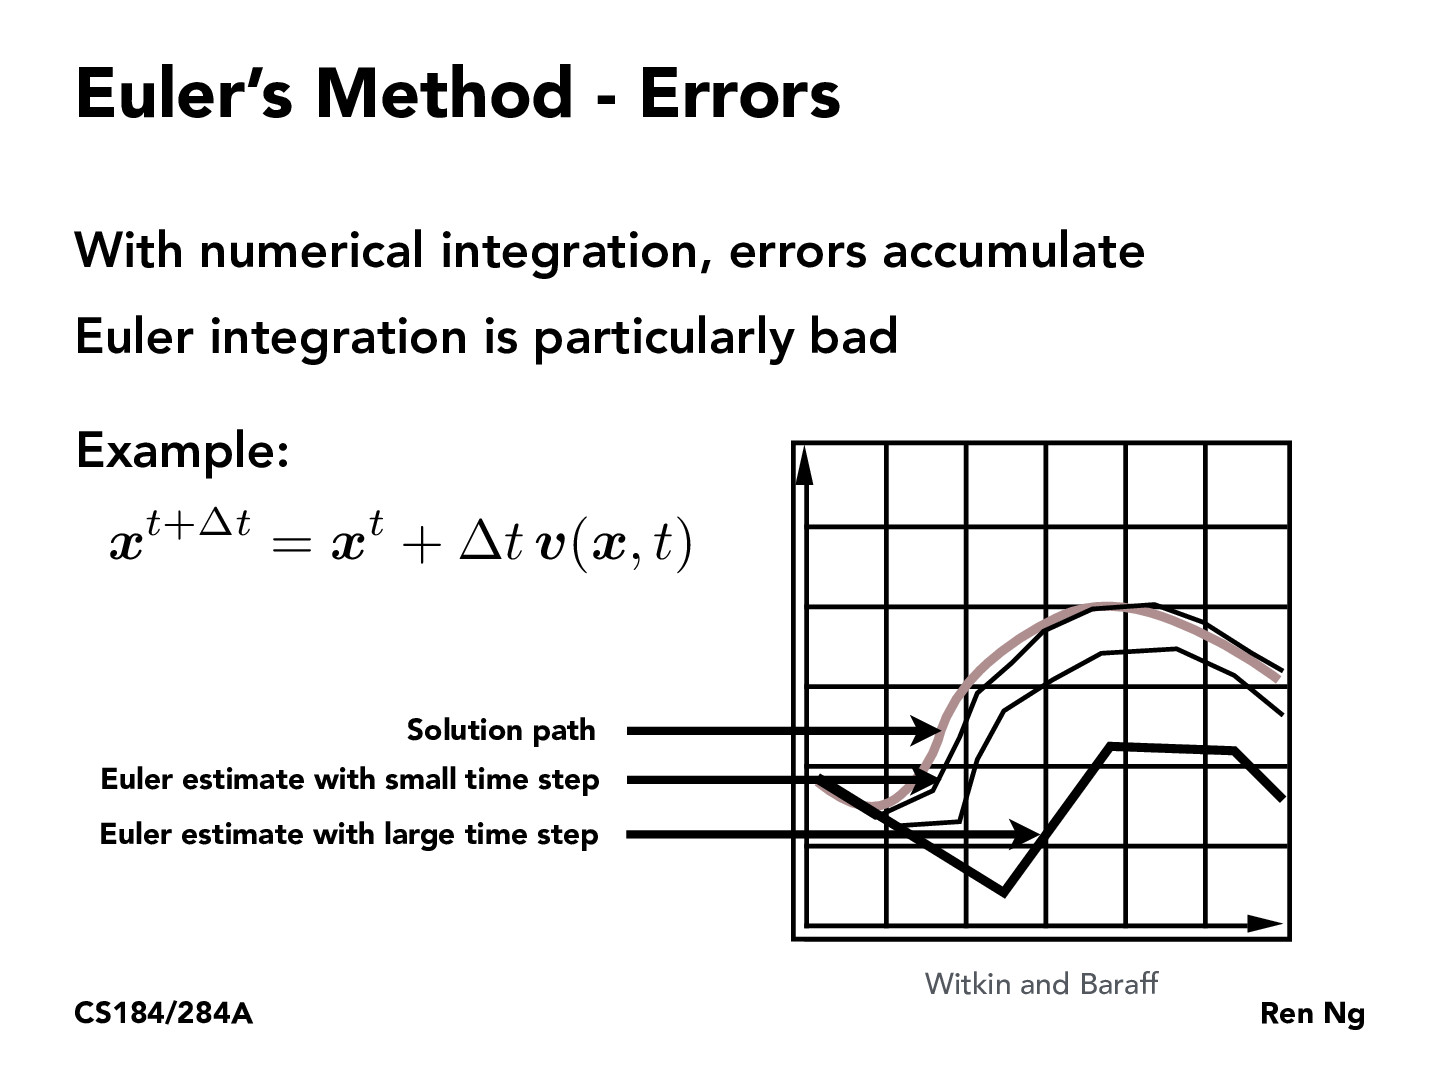
I'm not really sure what the x and y of the graph are supposed to represent. By guess is that the x axis is t (time) and y axis is x? Just by looking at the graph, is there any way to estimate what delta t might be? I feel like since it's easy to determine the discontinuities in the graph, delta t is probably quite large in this case?
moridin22
You're right about the axes. I don't think there are any specific numerical values for the delta ts, it looks like this plot was just roughly drawn by hand to demonstrate the idea of error accumulation.
qqqube
This articles talks about the math behind the forward and backwards euler
methods.
I'm not really sure what the x and y of the graph are supposed to represent. By guess is that the x axis is t (time) and y axis is x? Just by looking at the graph, is there any way to estimate what delta t might be? I feel like since it's easy to determine the discontinuities in the graph, delta t is probably quite large in this case?
You're right about the axes. I don't think there are any specific numerical values for the delta ts, it looks like this plot was just roughly drawn by hand to demonstrate the idea of error accumulation.
This articles talks about the math behind the forward and backwards euler methods.
http://web.mit.edu/10.001/Web/Course_Notes/Differential_Equations_Notes/node3.html