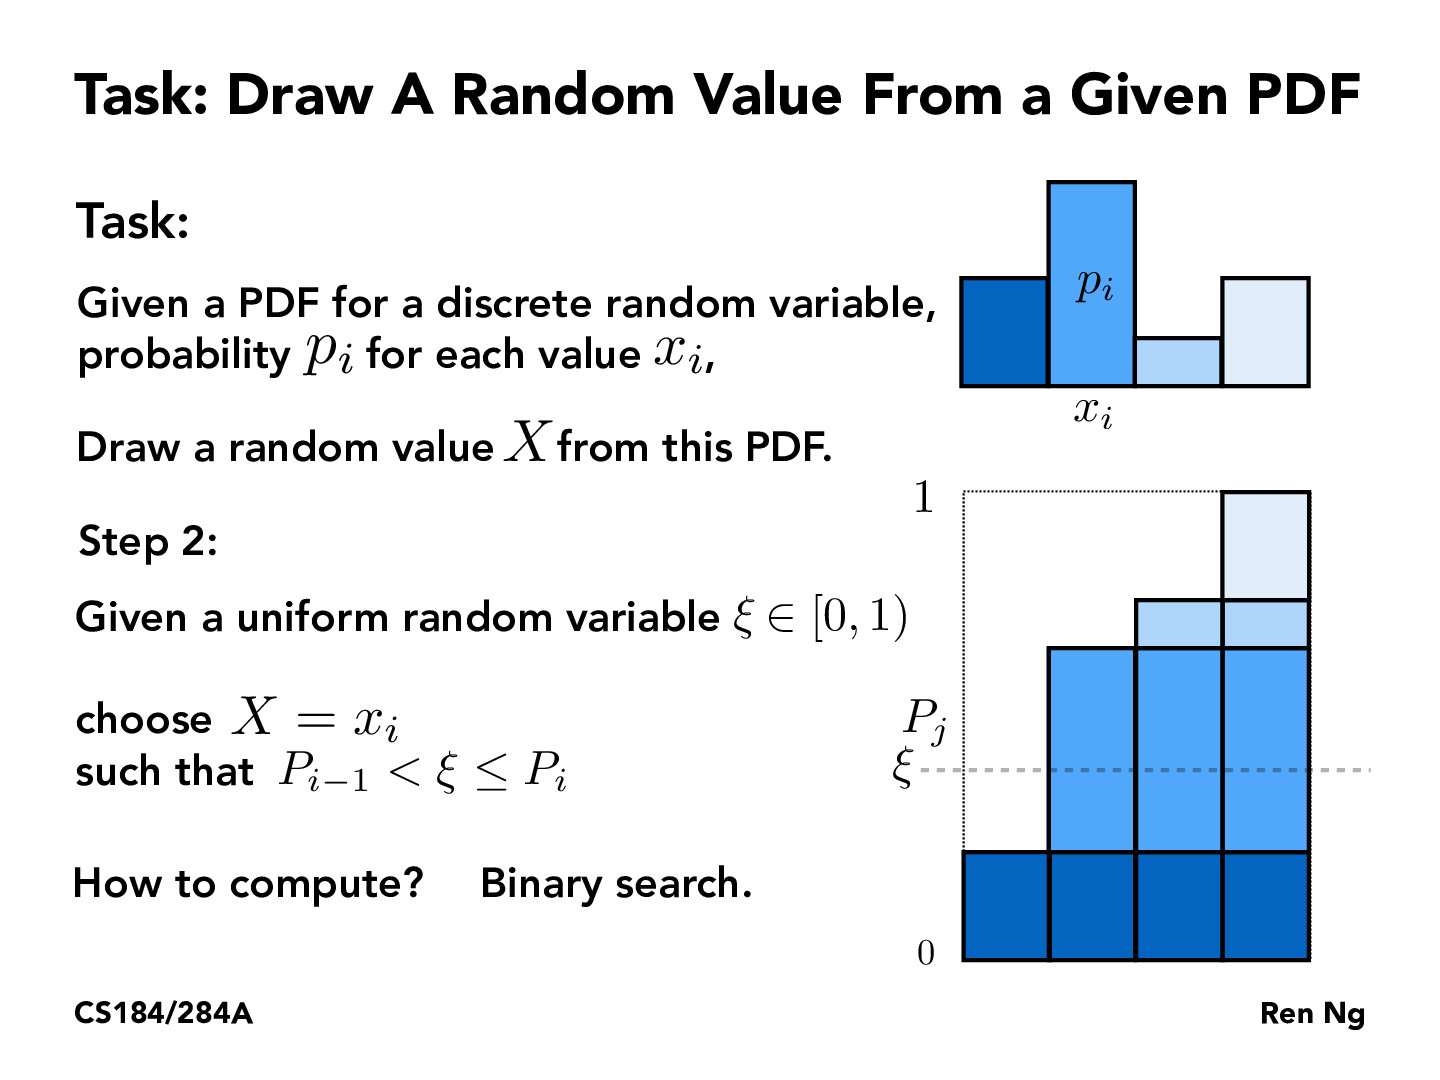
I feel like this could be done in constant time by quantizing P and doing linear interpolation between the quanta. For example with 100 levels you could generate a uniformly random floating point value, multiply by 100, cast it to an integer, and use that as an index into a map to look up the probability. Then, LERP it with the next index and you have a decent approximation of P that can be sampled in constant time.
yao12310
That's actually a pretty interesting thought––but what map would you be indexing into? I'm not sure if I'm fully following the method, but if you're just indexing directly into an ordered list of the 100 levels, I think you'd be losing the meaning of the underlying probabilities behind the levels.
That is, suppose you had 100 levels corresponding to x_i = i, i = 0, 1, ..., 99, all with probability mass .0001, so that their total probability mass is .01. Then, have a 101st level with probability mass .99. The approach given in lecture will select the 101st level about 99% of the time, but if the approach you're suggesting just indexes into a map of the levels, wouldn't that just uniformly select the levels regardless of their underlying probability mass?
I think I might be misunderstanding the map you're referring to: I haven't heard of this approach before, so would be cool to see if it actually works approximately as well.
yao12310
In any case, this approach of using a uniform distribution to sample to other distributions is super commonly used, and also generalizes very elegantly to the continuous distribution case (i.e. by inverting the normal CDF). Because it's used so often, I've gotten curious about exactly how that underlying uniform distribution is sampled, since it often seems like it's just said to "assume that you have a (0, 1)-uniform random variable." I think this note delves pretty rigorously into the interesting math behind it: https://statweb.stanford.edu/~owen/mc/Ch-unifrng.pdf.
austincheng
The concept here seems to be applied in many different places, as this kind of probability theory is covered in machine learning classes such as CS 188 and CS 189, and I never thought I would see it applied in computer graphics. Sampling was used in 188 to estimate probabilities in relation to Bayes Nets by sampling in the similar fashion here. This also seems like maximum likelihood estimator in a way, as MLE is used to estimate the distribution from samples, while here we are getting samples from a distribution.
I feel like this could be done in constant time by quantizing P and doing linear interpolation between the quanta. For example with 100 levels you could generate a uniformly random floating point value, multiply by 100, cast it to an integer, and use that as an index into a map to look up the probability. Then, LERP it with the next index and you have a decent approximation of P that can be sampled in constant time.
That's actually a pretty interesting thought––but what map would you be indexing into? I'm not sure if I'm fully following the method, but if you're just indexing directly into an ordered list of the 100 levels, I think you'd be losing the meaning of the underlying probabilities behind the levels.
That is, suppose you had 100 levels corresponding to x_i = i, i = 0, 1, ..., 99, all with probability mass .0001, so that their total probability mass is .01. Then, have a 101st level with probability mass .99. The approach given in lecture will select the 101st level about 99% of the time, but if the approach you're suggesting just indexes into a map of the levels, wouldn't that just uniformly select the levels regardless of their underlying probability mass?
I think I might be misunderstanding the map you're referring to: I haven't heard of this approach before, so would be cool to see if it actually works approximately as well.
In any case, this approach of using a uniform distribution to sample to other distributions is super commonly used, and also generalizes very elegantly to the continuous distribution case (i.e. by inverting the normal CDF). Because it's used so often, I've gotten curious about exactly how that underlying uniform distribution is sampled, since it often seems like it's just said to "assume that you have a (0, 1)-uniform random variable." I think this note delves pretty rigorously into the interesting math behind it: https://statweb.stanford.edu/~owen/mc/Ch-unifrng.pdf.
The concept here seems to be applied in many different places, as this kind of probability theory is covered in machine learning classes such as CS 188 and CS 189, and I never thought I would see it applied in computer graphics. Sampling was used in 188 to estimate probabilities in relation to Bayes Nets by sampling in the similar fashion here. This also seems like maximum likelihood estimator in a way, as MLE is used to estimate the distribution from samples, while here we are getting samples from a distribution.