Lecture 15: Advanced Topics in Material Modeling (17)
rileylyman184
Professor Yan didn't elaborate much on this, but it seems like the difference between this method and the statistical one we were introduced last lecture is that whereas the statistical model deals with averages and assumes that the scattering direction acts like a smooth curve, this method calculates the scattering directions much more explicitly given an actual microfacet description. Is this what others got from this as well?
kalebblack
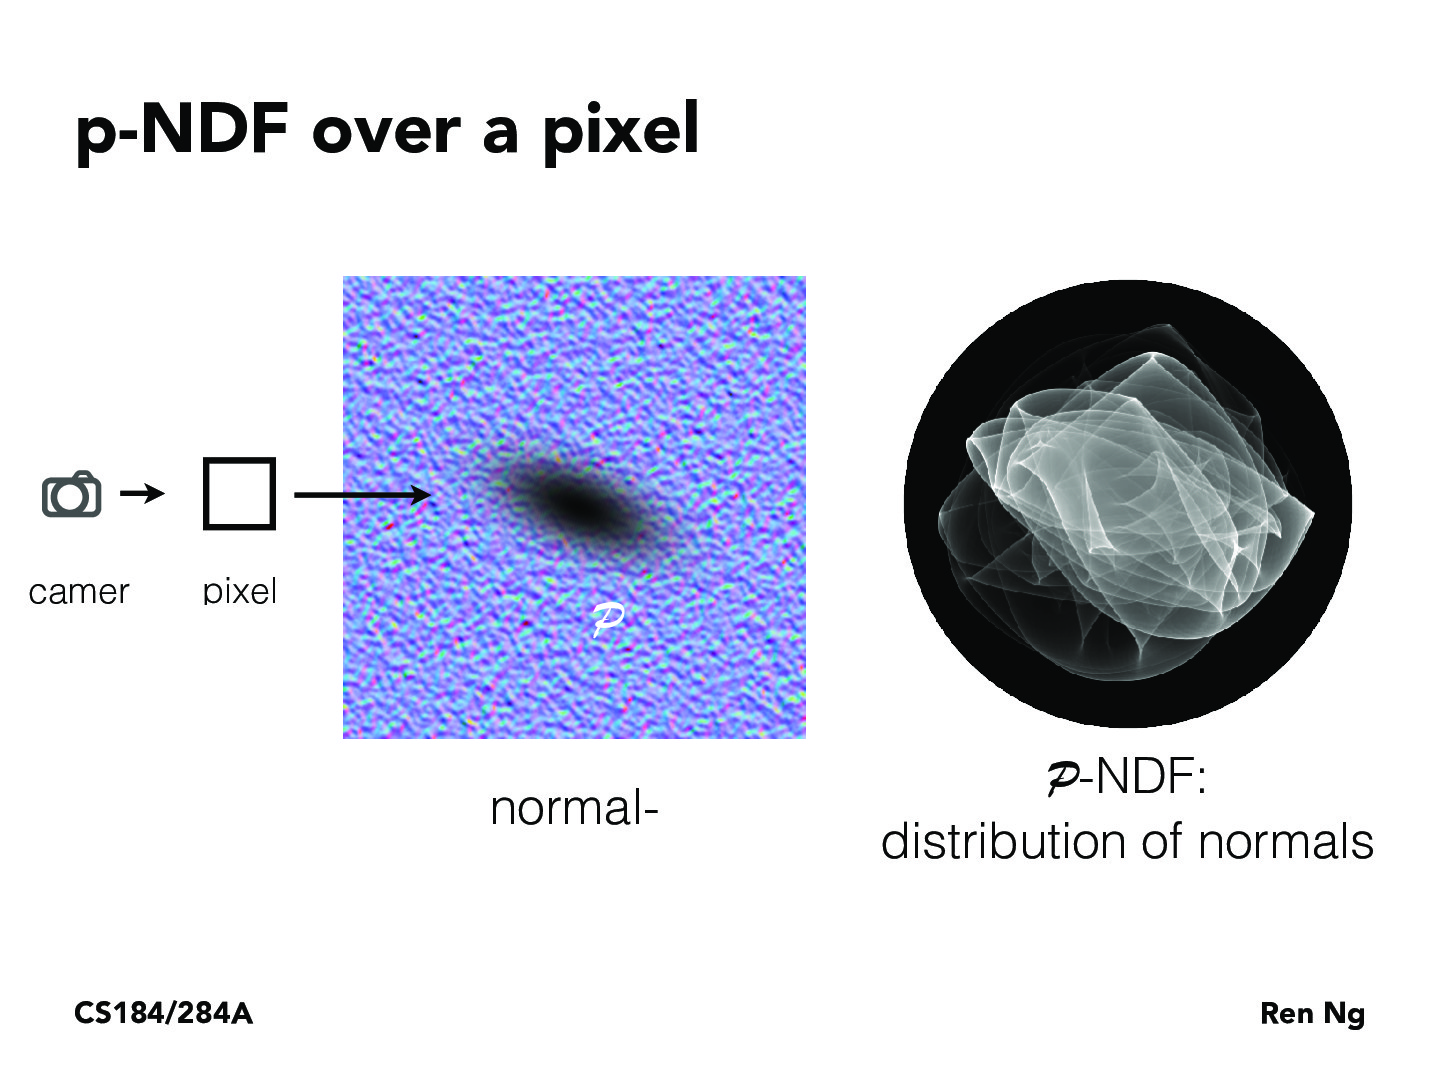
I'm confused on what the visualization of the P-NDF is actually representing on the right, does anyone have an explanation on what it is?
cathylu184
I think it represents a likelihood that a microfacet is pointing a certain direction? Though I am a little confused as well.
CTKnight
The dark part in normal- image is a projection of a pixel on the normal map. Sampling on this projection, we can get a 2D histogram. And the histogram is visualized in a way that the brighter colors indicate the higher likelihood. If isotropic BRDF are visualized in this way, they could be rings/circle with different color at different radius.
Professor Yan didn't elaborate much on this, but it seems like the difference between this method and the statistical one we were introduced last lecture is that whereas the statistical model deals with averages and assumes that the scattering direction acts like a smooth curve, this method calculates the scattering directions much more explicitly given an actual microfacet description. Is this what others got from this as well?
I'm confused on what the visualization of the P-NDF is actually representing on the right, does anyone have an explanation on what it is?
I think it represents a likelihood that a microfacet is pointing a certain direction? Though I am a little confused as well.
The dark part in normal- image is a projection of a pixel on the normal map. Sampling on this projection, we can get a 2D histogram. And the histogram is visualized in a way that the brighter colors indicate the higher likelihood. If isotropic BRDF are visualized in this way, they could be rings/circle with different color at different radius.