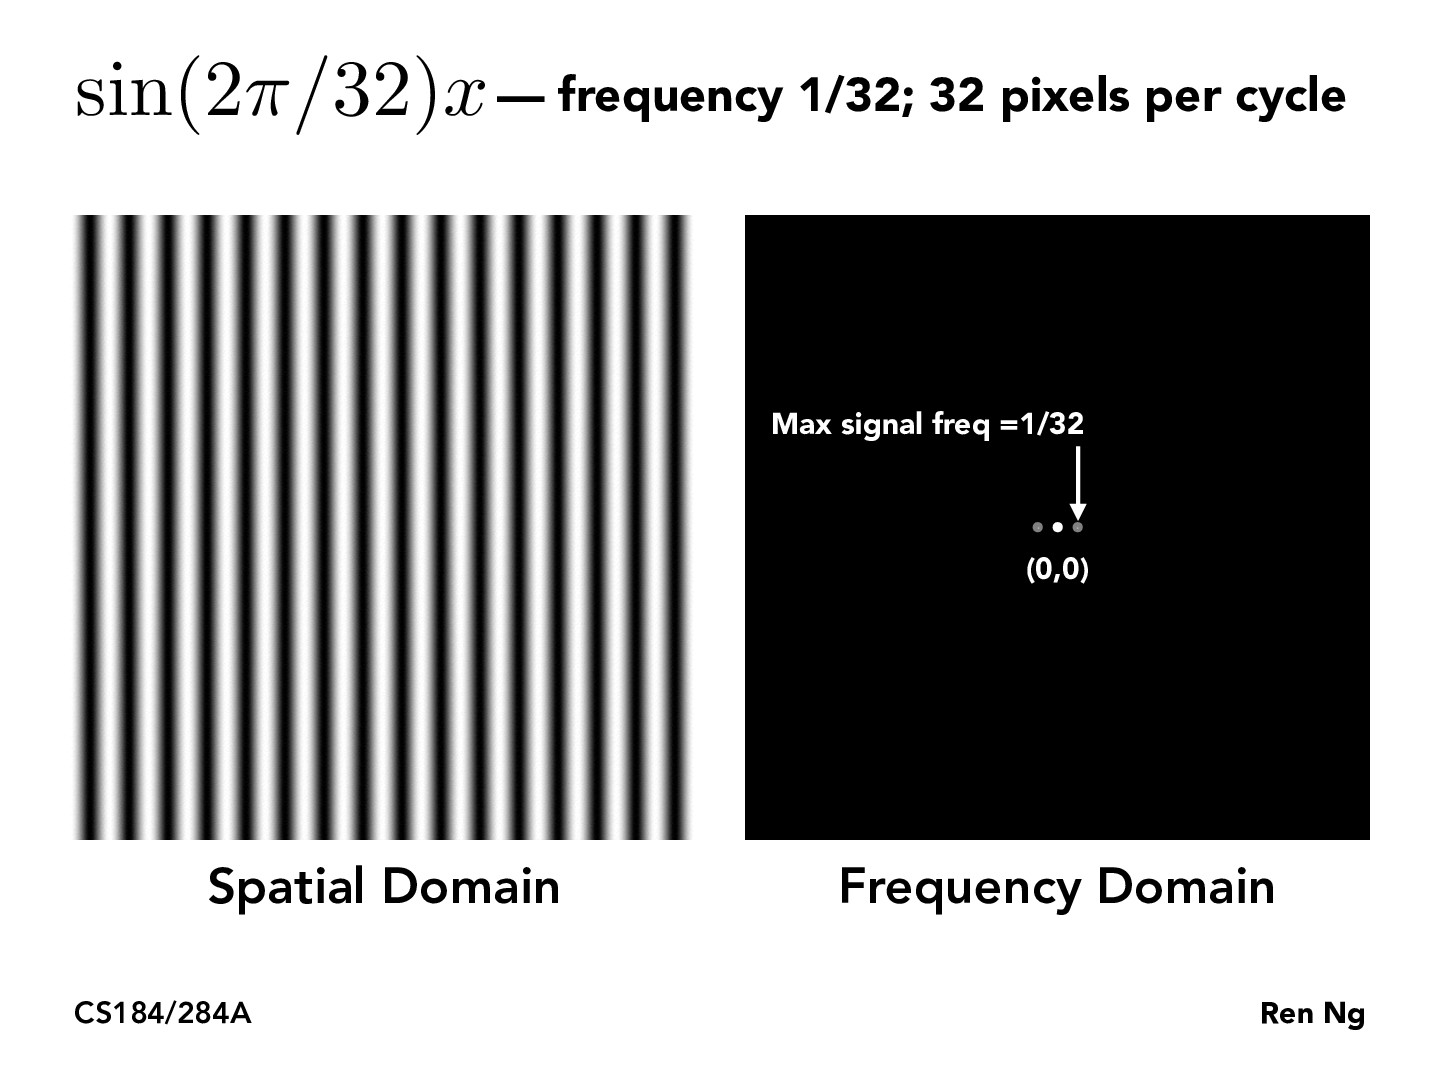
is there any intuitive way to understand how pixels in the spatial domain translate to points in the frequency domain? I understand that the farther you are from the origin in the frequency domain, the higher the signal that is present, but I have no intuitive understanding as to why
et-yao
Adding on to that, what does the relative shade of each dot represent? i.e. grey vs white. Is it amplitude?
ellinzhao
Since this example only has changes in pixel intensities in the x direction, maybe reduce the spatial domain to a single row of the image and think about what frequency that row is.
Staffkatamarisun
Consider x coordinates as horizontal contributions (horizontal varying signals), y coordinates as vertical contributions, and any other point some combination of both. Each dot in the frequency domain represents the corresponding contribution of that frequency; so, for example, the center pixel represents the DC component, or the constant color signal through the whole image. (As a side question, photos almost ALWAYS have a DC component - why? Images are always stored as positive values, and so are centered around a positive DC bias).
The two side points represent the single cosine (or sine) term. Why are there two components? The Fourier transform represents the components of all e^(jw) terms for all frequencies w. Cosines can be decomposed into cos(wx) = (e^(jw) + e^(-jw)) / 2. See the Euler formula for more info. https://en.wikipedia.org/wiki/Euler%27s_formula
is there any intuitive way to understand how pixels in the spatial domain translate to points in the frequency domain? I understand that the farther you are from the origin in the frequency domain, the higher the signal that is present, but I have no intuitive understanding as to why
Adding on to that, what does the relative shade of each dot represent? i.e. grey vs white. Is it amplitude?
Since this example only has changes in pixel intensities in the x direction, maybe reduce the spatial domain to a single row of the image and think about what frequency that row is.
Consider x coordinates as horizontal contributions (horizontal varying signals), y coordinates as vertical contributions, and any other point some combination of both. Each dot in the frequency domain represents the corresponding contribution of that frequency; so, for example, the center pixel represents the DC component, or the constant color signal through the whole image. (As a side question, photos almost ALWAYS have a DC component - why? Images are always stored as positive values, and so are centered around a positive DC bias).
The two side points represent the single cosine (or sine) term. Why are there two components? The Fourier transform represents the components of all e^(jw) terms for all frequencies w. Cosines can be decomposed into cos(wx) = (e^(jw) + e^(-jw)) / 2. See the Euler formula for more info. https://en.wikipedia.org/wiki/Euler%27s_formula