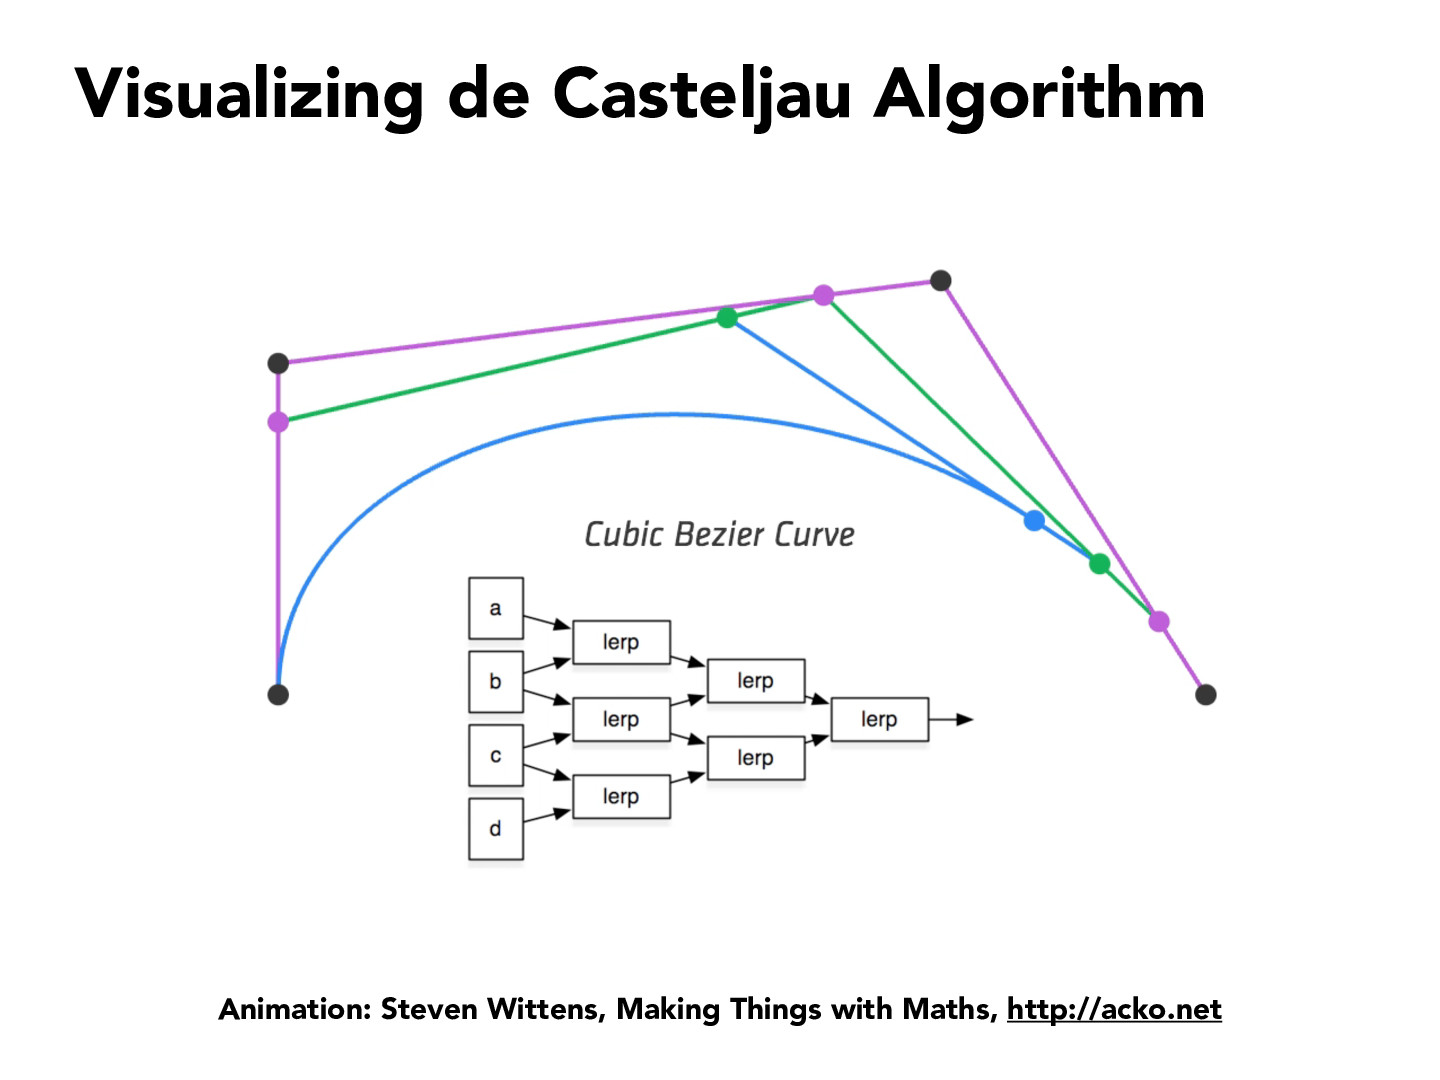
I found an interesting interactive visualization of de Casteljau for a varying number of points (2 to 5). The visualization itself enables movement of points, giving a pretty interesting display of the algorithm and the resulting bezier curve. The animation shows all distinct linear interpolation steps similar to the graphic on this slide.
I found an interesting interactive visualization of de Casteljau for a varying number of points (2 to 5). The visualization itself enables movement of points, giving a pretty interesting display of the algorithm and the resulting bezier curve. The animation shows all distinct linear interpolation steps similar to the graphic on this slide.
Demo