Can different distributions look the same to the human eye? I'm wondering if a uniform distribution of light may look the same to a human or camera as a distribution of energy in which all wavelengths have zero intensity except for R G and B
Cheng-David
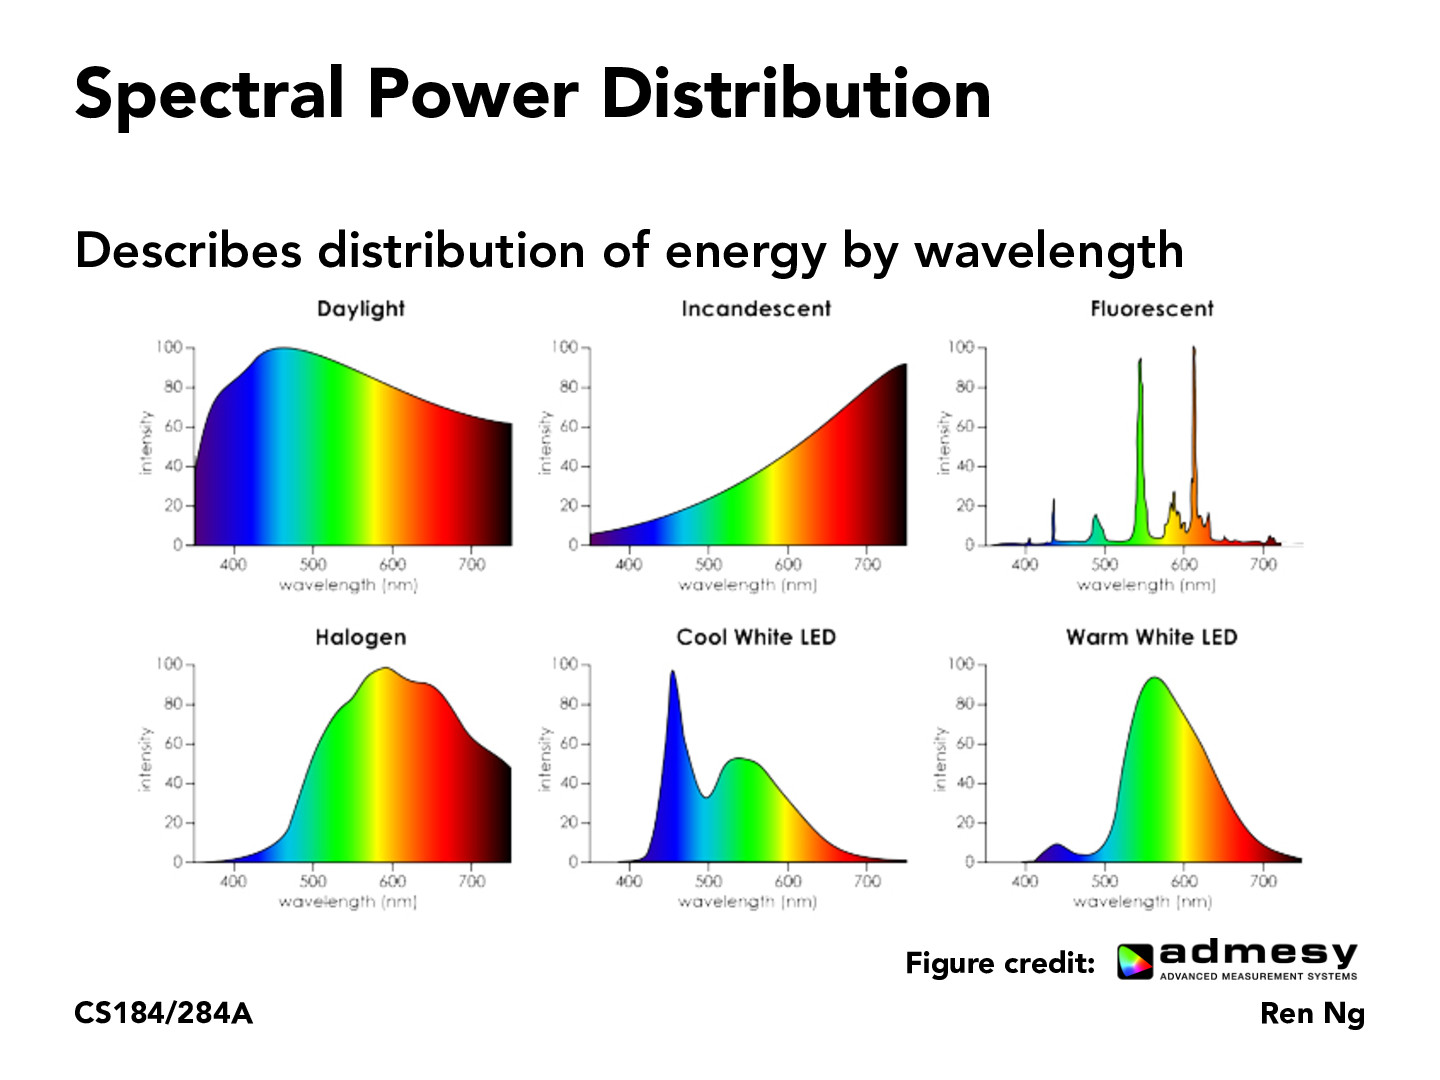
Why are there green and red peaks for the fluorescent graph? Also why does its graph seem more jagged and less smooth compared to the other light sources?
ivyn
How do the distributions change when there are multiple light sources? I'm wondering if it's additive or if there's some uneven mix.
mkassaian
From what I can tell, the fluorescent light has such a spikey spectral power distribution graph because it generates light via exciting a gas (mercury vapor) with electricity. When excited, gasses release photons at very specific frequencies, compared to something like an incandescent which simply heats a filament, creating a smooth power distribution.
shariewang
What properties of incandescent light give it such a smooth and gradual energy distribution graph?
vibhavad
Is there a way to imitate the spectra that daylight emits in a man-made light? Or are we limited by emitting only certain wavelengths at once as opposed to all?
jsdonn
@mkassaian shouldn't LEDs behave the same way then? because the way that LEDs work is that they just emit one frequency of light.
et-yao
What would a neon light's distribution look like?
SourMongoose
I find it interesting that even though red, orange, and yellow are known as the warmer colors of the spectrum, the Warm White LED still peaks at around the green range.
Can different distributions look the same to the human eye? I'm wondering if a uniform distribution of light may look the same to a human or camera as a distribution of energy in which all wavelengths have zero intensity except for R G and B
Why are there green and red peaks for the fluorescent graph? Also why does its graph seem more jagged and less smooth compared to the other light sources?
How do the distributions change when there are multiple light sources? I'm wondering if it's additive or if there's some uneven mix.
From what I can tell, the fluorescent light has such a spikey spectral power distribution graph because it generates light via exciting a gas (mercury vapor) with electricity. When excited, gasses release photons at very specific frequencies, compared to something like an incandescent which simply heats a filament, creating a smooth power distribution.
What properties of incandescent light give it such a smooth and gradual energy distribution graph?
Is there a way to imitate the spectra that daylight emits in a man-made light? Or are we limited by emitting only certain wavelengths at once as opposed to all?
@mkassaian shouldn't LEDs behave the same way then? because the way that LEDs work is that they just emit one frequency of light.
What would a neon light's distribution look like?
I find it interesting that even though red, orange, and yellow are known as the warmer colors of the spectrum, the Warm White LED still peaks at around the green range.